Free Access
Fig. A.2
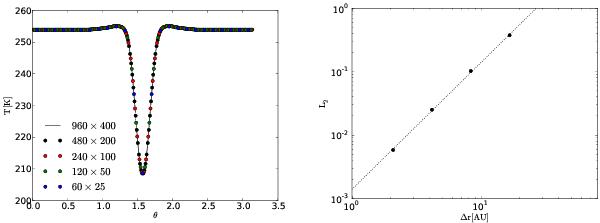
Left: vertical temperature profiles at 2 AU for different resolutions. Right: L2 norm of the relative error (black dots) over the typical cell size Δr = (rout − rin)/Nr. The dotted line shows the theoretical second-order scheme slope ∝(Δr)2.
Current usage metrics show cumulative count of Article Views (full-text article views including HTML views, PDF and ePub downloads, according to the available data) and Abstracts Views on Vision4Press platform.
Data correspond to usage on the plateform after 2015. The current usage metrics is available 48-96 hours after online publication and is updated daily on week days.
Initial download of the metrics may take a while.