Free Access
Fig. 12
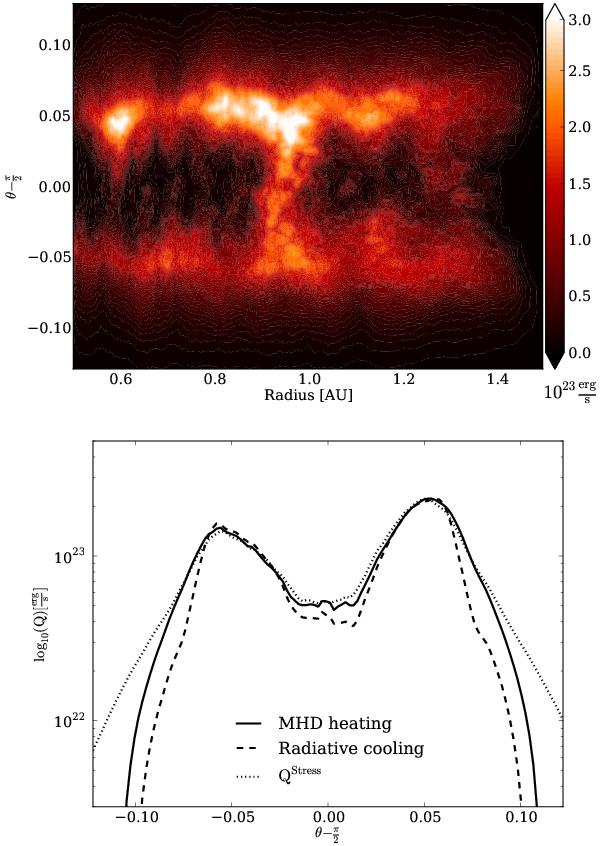
Top: 2D contour plot of expected theoretical heating QStress in units of 1023, azimuthally and time averaged over 40 inner orbits. Bottom: vertical profile of the MHD heating QMHD (solid line), radiative cooling − QRad (dashed line), and theoretically expected MHD heating QStress (dotted line).
Current usage metrics show cumulative count of Article Views (full-text article views including HTML views, PDF and ePub downloads, according to the available data) and Abstracts Views on Vision4Press platform.
Data correspond to usage on the plateform after 2015. The current usage metrics is available 48-96 hours after online publication and is updated daily on week days.
Initial download of the metrics may take a while.