Fig. 10
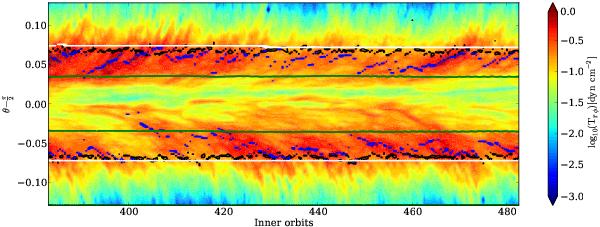
Time evolution of the azimuthally averaged total stress Trφ over height at 1 AU. We overplot the location of largest stress (blue contour), largest relative temperature fluctuations (black contour), the vertical location of the τ = 1 position of the irradiation (white contour), and the vertical location of the τ = 1 position for the local thermal radiation (green contour) for each time bin.
Current usage metrics show cumulative count of Article Views (full-text article views including HTML views, PDF and ePub downloads, according to the available data) and Abstracts Views on Vision4Press platform.
Data correspond to usage on the plateform after 2015. The current usage metrics is available 48-96 hours after online publication and is updated daily on week days.
Initial download of the metrics may take a while.