Fig. 5
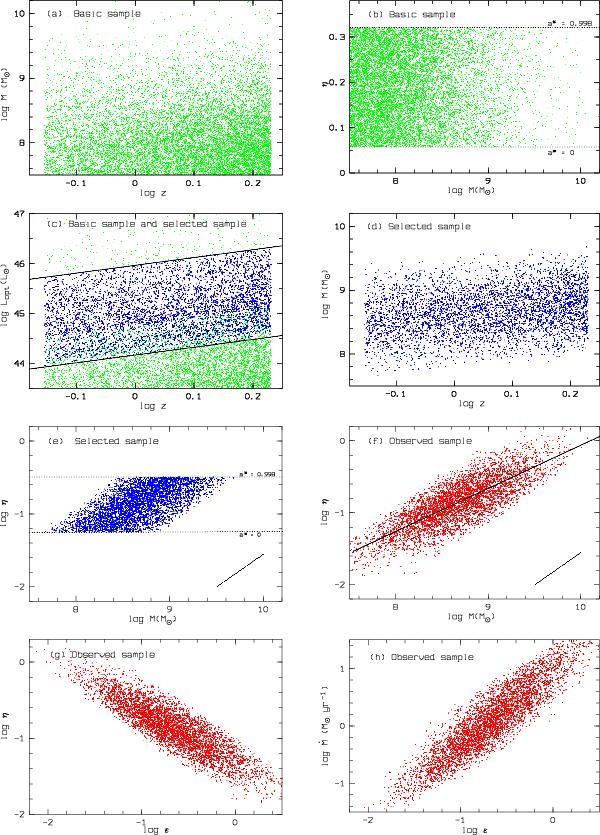
Simulated basic quasar sample (a)–c); small green dots), selected sample (c)–e); small blue crosses), and simulated “observed” quasar sample (f)–h); small red crosses). The selection is based solely on the luminosity limits of the SDSS sample (c); see also Fig. 4a). The thick diagonal lines in the lower right corner of panels e) and f) indicate the displacement for a 0.5 dex shift in M. The “observed” sample is identical with the selected sample but mass errors were involved in the latter. Panels f) to h) show correlations in the “observed” sample. Solid line in f): linear regression curve. See the text for a more detailed description.
Current usage metrics show cumulative count of Article Views (full-text article views including HTML views, PDF and ePub downloads, according to the available data) and Abstracts Views on Vision4Press platform.
Data correspond to usage on the plateform after 2015. The current usage metrics is available 48-96 hours after online publication and is updated daily on week days.
Initial download of the metrics may take a while.