Fig. B.1
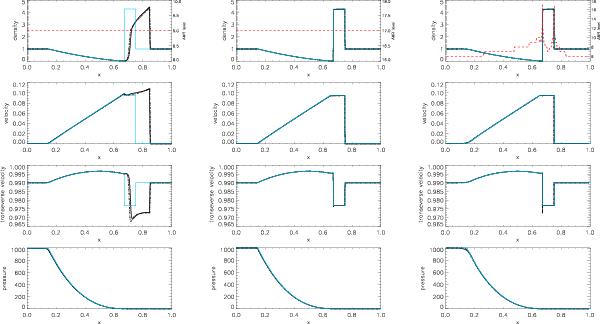
Density, AMR levels (red dashed line), parallel and transverse velocity and pressure in the frame of the laboratory for the shock test with Γmax = 120. Left panels: uniform grid nx = 512; middle panels: uniform grid nx = 217 = 131072; right panels: nx = 64, lmax = 17. The black solid line represents the MUSCL method, while the black dashed line represents the PLM method. At high resolution, they give the same result, which is very close to the analytic solution.
Current usage metrics show cumulative count of Article Views (full-text article views including HTML views, PDF and ePub downloads, according to the available data) and Abstracts Views on Vision4Press platform.
Data correspond to usage on the plateform after 2015. The current usage metrics is available 48-96 hours after online publication and is updated daily on week days.
Initial download of the metrics may take a while.