Fig. 8
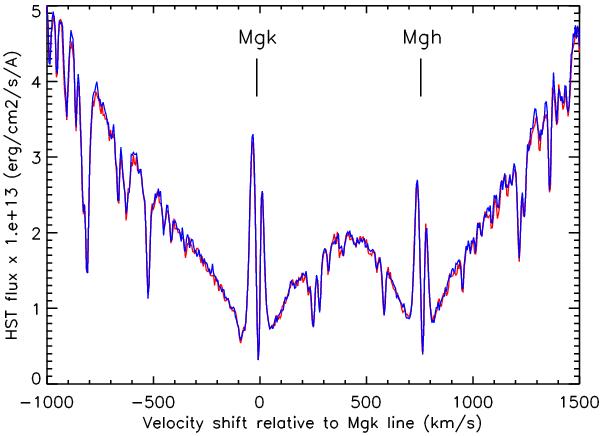
Mg ii lines spectral region (Mg ii-k line at 2796.35 Å and Mg ii-h line at 2803.53 Å). The spectrum is observed during the two first transits. The average of orbits #2 and #5 (blue line) represents the Out of transit spectrum, while the average of orbits #3 and #4 (red line) represents the In transit spectrum. Wavelengths are transformed into velocity shifts relative to the Mg ii-k line (individual pixels correspond to about 5 km s-1 bandwidth).
Current usage metrics show cumulative count of Article Views (full-text article views including HTML views, PDF and ePub downloads, according to the available data) and Abstracts Views on Vision4Press platform.
Data correspond to usage on the plateform after 2015. The current usage metrics is available 48-96 hours after online publication and is updated daily on week days.
Initial download of the metrics may take a while.