Fig. 7
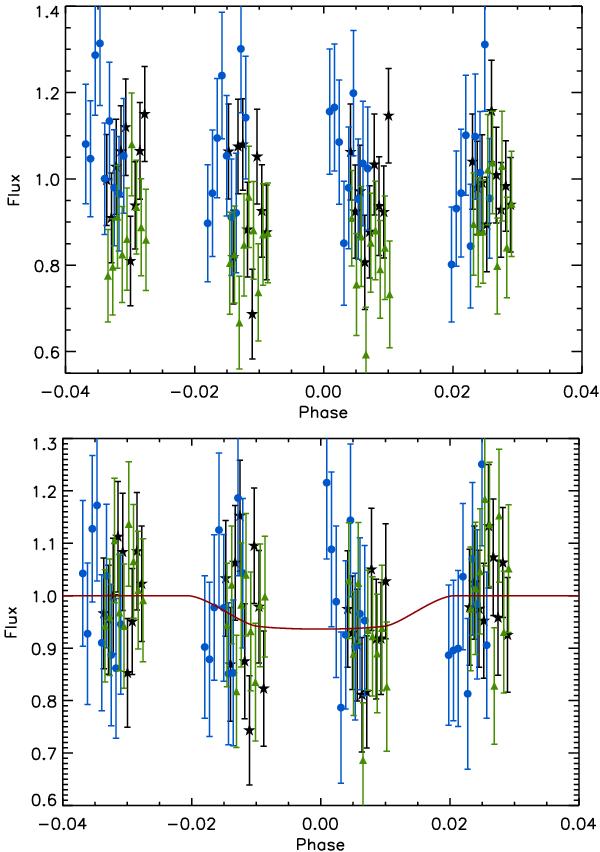
Transit light curve measured in the − 62 to − 19 km s-1 spectral domain. The out-of-transit reference corresponds to the measurements in the orbits #2 (before transit) and #5 (after transit). Upper panel: raw observations. Lower panel: the limb-darkening and all trend correction that are included along with the final global fit (red solid line). All subexposures (black dots for transit #1, blue dots for transit #2 and green dots for transit #3) are shown. The evaluated AD that corresponds to the spectral domain is equal to 6.2 ± 2.9%. Note how flattened the limb-darkening looks: the reason being that the larger Mg i absorption gives a significantly larger planetary radius, which acts to smooth out the limb-darkening profile.
Current usage metrics show cumulative count of Article Views (full-text article views including HTML views, PDF and ePub downloads, according to the available data) and Abstracts Views on Vision4Press platform.
Data correspond to usage on the plateform after 2015. The current usage metrics is available 48-96 hours after online publication and is updated daily on week days.
Initial download of the metrics may take a while.