Fig. 5
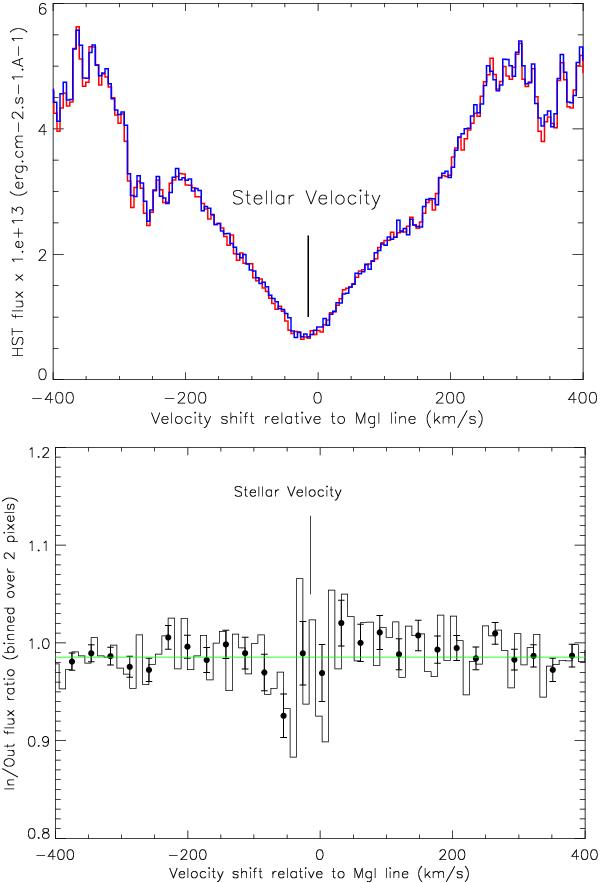
Mg i line spectral region. Upper panel: the spectrum observed during the three transits. The average of orbits #2 and #5 (blue line) represent the Out of transit spectrum while the average of orbits #3 and #4 (red line) represent the In transit spectrum. Wavelengths are transformed into velocity shifts relative to the Mg i rest wavelength (individual pixels correspond to about 5 km s-1 bandwidth). Lower panel: the In/Out ratio of the two spectra (orbits #3 and #4 divided by orbits #2 and #5). The horizontal green line at the AD = 1.444% level corresponds to the Sing et al. (2008a) absorption depth evaluation at 5000 Å. The histogram shows the ratio rebinned over one resolution element which is over two instrument pixels (about 10 km s-1). The black dots give the ratios rebinned by 6 pixels with corresponding error bars, showing a single feature detected at more than 2-σ over a wide range of wavelengths.
Current usage metrics show cumulative count of Article Views (full-text article views including HTML views, PDF and ePub downloads, according to the available data) and Abstracts Views on Vision4Press platform.
Data correspond to usage on the plateform after 2015. The current usage metrics is available 48-96 hours after online publication and is updated daily on week days.
Initial download of the metrics may take a while.