Fig. 4
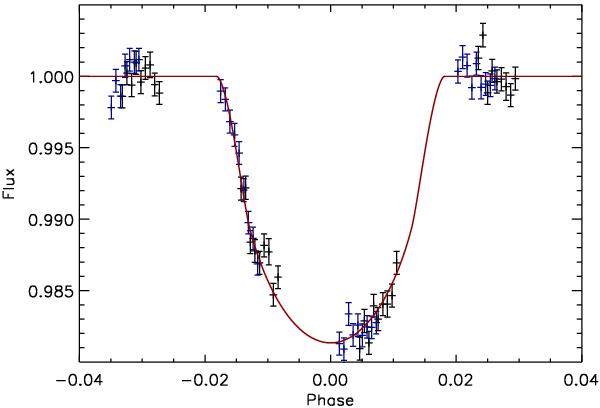
Transit light curves over the broadband 2900–3100 Å that show the measurements obtained over each individual sub-exposure (black dots for transit #1, and blue dots for transit #2) as a function of the planet’s orbital phase. The first and last group of points, before and after the transit, around phase − 0.34 and +0.25 respectively, correspond to the Out of transit orbits #2 and #5, while the two other groups around phase − 0.15 and +0.05 correspond to the In transits observations that are completed respectively during orbit #3 (during ingress) and orbit #4 (deep within the transit). The solid red line shows the fitted profile, including limb-darkening and instrument breathing corrections.
Current usage metrics show cumulative count of Article Views (full-text article views including HTML views, PDF and ePub downloads, according to the available data) and Abstracts Views on Vision4Press platform.
Data correspond to usage on the plateform after 2015. The current usage metrics is available 48-96 hours after online publication and is updated daily on week days.
Initial download of the metrics may take a while.