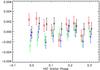
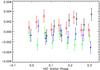
Fig. 3
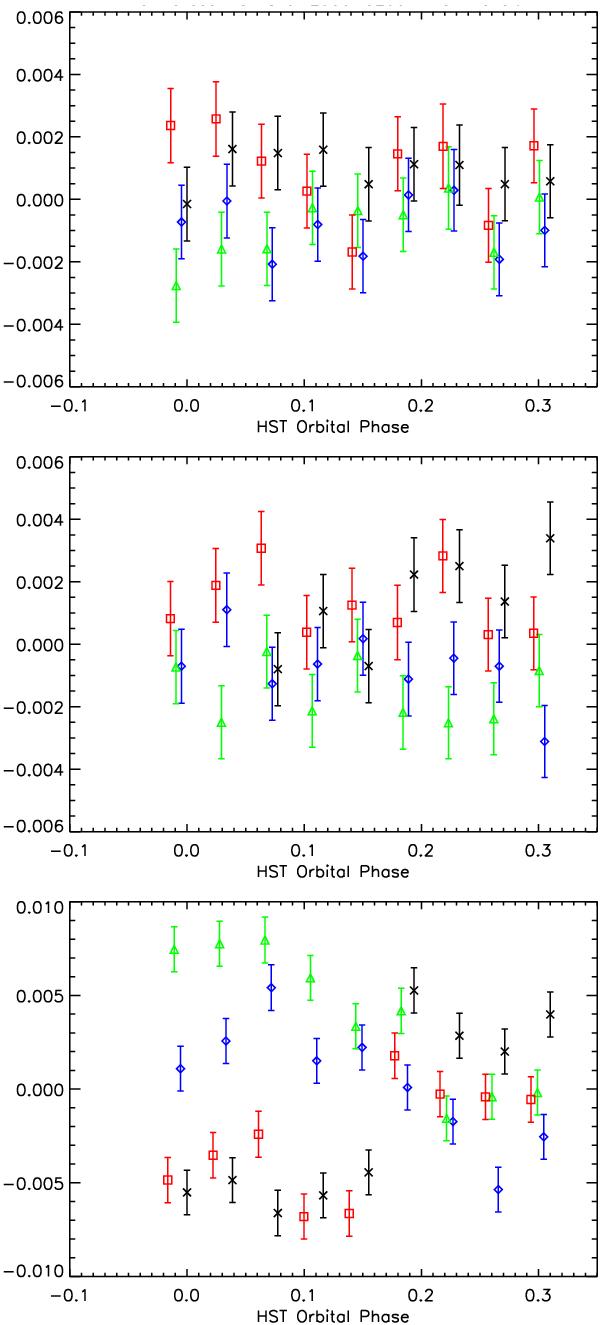
Same as Fig. 2 for the fluxes of each sub-exposure normalized by the total flux that is measured during the transit and corrected for all trends as discussed (see text). Upper plot: transit #1. The overall fluctuation after correction is ± 0.2%. Middle plot: same as upper plot for transit #2. Overall fluctuation: ± 0.3%. Lower plot: same as upper plot for transit #3. Note here the different ordinate scale showing the relatively more perturbed transit #3. For that transit, the overall fluctuation is ± 0.7%.
Current usage metrics show cumulative count of Article Views (full-text article views including HTML views, PDF and ePub downloads, according to the available data) and Abstracts Views on Vision4Press platform.
Data correspond to usage on the plateform after 2015. The current usage metrics is available 48-96 hours after online publication and is updated daily on week days.
Initial download of the metrics may take a while.