Fig. 2
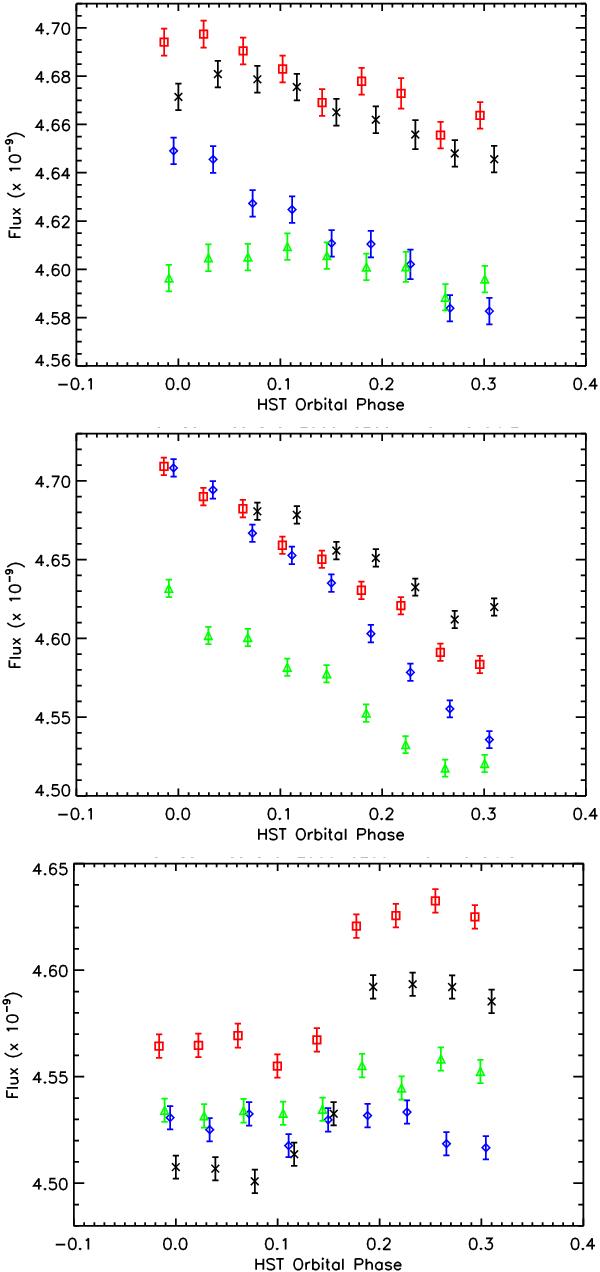
Total HST flux of each sub-exposure measured over the 2900 − 3100 Å spectral domain as a function of the HST orbital phase (in erg cm-2 s-1). Upper plot: transit #1. During this transit, successive HST orbits are shown (orbit #2, black crosses, orbit #3, blue diamonds, orbit #4, green triangles and orbit #5, red squares). Middle plot: same as upper plot for transit #2. Lower plot: same as upper plot for transit #3.
Current usage metrics show cumulative count of Article Views (full-text article views including HTML views, PDF and ePub downloads, according to the available data) and Abstracts Views on Vision4Press platform.
Data correspond to usage on the plateform after 2015. The current usage metrics is available 48-96 hours after online publication and is updated daily on week days.
Initial download of the metrics may take a while.