| Issue |
A&A
Volume 560, December 2013
|
|
|---|---|---|
| Article Number | A27 | |
| Number of page(s) | 12 | |
| Section | Stellar structure and evolution | |
| DOI | https://doi.org/10.1051/0004-6361/201322162 | |
| Published online | 02 December 2013 | |
WR 138: new results from X-ray and optical spectroscopy⋆,⋆⋆
1
Institut d’Astrophysique et de Géophysique, Université de
Liège, Bât. B5c, Allée du 6 Août
17, 4000
Liège, Belgium
e-mail: This email address is being protected from spambots. You need JavaScript enabled to view it.
2
Departamento de Astronomia, Universidad de
Guanajuato, Apartado
144, 36000
Guanajuato, GTO, Mexico
Received: 28 June 2013
Accepted: 8 October 2013
Abstract
Context. Massive-binary evolution models predict that some systems will go through an evolutionary phase where the original primary has become a supernova and left a compact object behind that then orbits a Wolf-Rayet (WR) star. WR 138 is an X-ray bright WR star that has been described as a triple system, including a compact companion in a short-period orbit.
Aims. Our goal is to search for spectroscopic evidence of a compact companion around WR 138.
Methods. We used optical and X-ray spectra to search for signatures of a compact companion, which can be revealed by systematic variations in WR optical spectral lines induced by orbital motion of the compact companion or by hard, luminous X-rays from accretion onto this companion.
Results. The optical spectra display emission-line profile variations that are most probably caused by clumps inside the stellar winds. The radial velocities do not vary on a short time-scale compatible with the suggested orbital period of a putative compact companion. The X-ray spectra are found to be normal for a WN5-6+OB system with no indication of accretion by a compact companion.
Conclusions. There is no evidence for the presence of a compact companion, and we therefore conclude that WR 138 is a normal long-period (P ~ 1521 d) eccentric WR+OB system.
Key words: stars: early-type / stars: Wolf-Rayet / stars: massive / stars: individual: WR 138 (HD 193077) / X-rays: stars
Based on observations collected at the Observatoire de Haute-Provence (France), the San Pedro Mártir observatory (Mexico), and with XMM-Newton, an ESA science mission with instruments and contributions directly funded by ESA member states and the USA (NASA).
Tables 2–5 are available in electronic form at http://www.aanda.org
Research Associate FRS-FNRS.
© ESO, 2013
1. Introduction
Whilst absorption lines in the spectrum of WR 138 were recognized several decades ago, the multiplicity of this star has been an open question for a long time. Massey (1980) found no evidence for significant (K ≥ 30 km s-1) radial velocity (RV) variations that would have been attributable to an orbital motion of the emission lines and suggested that the broad (v sini ≃ 500 km s-1) absorption lines were intrinsic to the WN star. From a series of photographic spectra, Lamontagne et al. (1982) noted low-amplitude RV variations of the N iv λ 4058 line on a period of 2.3238 d, although other periods, such as 0.39 d, could not be fully excluded. These variations were not seen in the He ii λ 4686 line. The absorption lines did not display variations on this period either. In addition, Lamontagne et al. (1982) noted that the RVs of both the emission and absorption lines vary on a long period of about 1763 or 1533 d. As a result, they classified WR 138 as a triple system consisting of a WN6 star orbited by an unseen low-mass companion, probably a neutron star, in a 2.3238 d orbit and an O-type star in a 1763 d orbit. The interpretation of the short-period variations as the orbital period of a compact companion was questioned by Vreux (1985), who drew attention to the ambiguity of the period determination due to the aliasing problem. He suggested that alternative mechanisms, such as non-radial pulsations, could produce modulations of the spectra of Wolf-Rayet (WR) stars on periods that could be aliases of those reported in the literature. Annuk (1990) analysed a series of medium-dispersion spectra of WR 138 and reported RV variations with a period of 1538 ± 14 d (although a period of 1420 d could not be fully excluded), an amplitude of about 60 km s-1, and a moderate eccentricity of 0.3. He was unable, however, to confirm the short-period variations of the RVs reported by Lamontagne et al. (1982). X-ray observations are expected to provide an independent indication about the presence or absence of a compact companion in WR 138. Indeed, the presence of a neutron star in a close orbit around a WN star should lead to substantial accretion by the former and would thus produce a strong and hard X-ray emission, as seen in high-mass X-ray binaries (see e.g. Negueruela 2010). The X-ray emission from WR 138 was detected with the Einstein observatory (Pollock 1987) and within the All Sky Survey of ROSAT (Pollock et al. 1995). However, these observations did not provide the level of detail required to clarify the nature of the X-ray emission. In this paper, we present new X-ray observations of WR 138 augmented by several new series of optical spectra to re-investigate whether there is a compact companion in a short-period orbit around the WN star.
2. Observations
2.1. X-ray observations
WR 138 was observed serendipitously with XMM-Newton (Jansen et al. 2001) in May 2011, during three exposures of 20 ks each centred on the massive binary HDE 228766 (Rauw et al., in prep.; ID 067048). EPIC instruments (Turner et al. 2001; Strüder et al. 2001) were operated in full-frame mode and the medium filter was used to reject optical and UV photons.
The raw data were processed with SAS software version 12.0. The first two observations were affected by background flares, and we therefore rejected these high-background episodes from further processing. Because WR 138 was located 9′ off-axis in these pointings, the source sometimes fell on a gap between the detector chips or on the dead CCD of the MOS 1 detector. As a consequence, not all EPIC instruments provided useful data for WR 138 for each exposure. In particular, we decided to restrict our analysis to MOS 2 and pn data. The extraction zones consist of a circle of 40′′ centred on the source and a nearby circular zone of 35′′ radius in a source-free region for the background. The spectra were binned with a minimum of 25 counts per bin of energy channel and a maximum oversampling of the resolution element by a factor 5.
Journal of the XMM-Newton observations.
Several other X-ray observations were also available in the HEASARC archives. WR 138 was observed with ROSAT in October 1993, in June 1994 with the PSPC instrument, and in November 1994 with the HRI instruments (SEQ ID RP500248N00, RP500248A01, and RH500341N00). The exposure durations were 3.6, 4.2, and 42.8 ks, respectively. WR 138 was also observed with Swift in March 2011 (OBS ID 00040153001) with an exposure time of 1 ks. Finally, a Chandra observation of 69.3 ks made in January 2010 (OBS ID 11092) was also available. In all the ROSAT and Chandra observations, WR 138 is located far off-axis, leading to a severe degradation of the PSF. We downloaded the processed data and extracted the spectra of WR 138 for these five archival observations. The extraction zone for the Swift data consists of a circular zone with a radius of 50′′ around the star and the surrounding annulus with an outer radius of 213′′ for the background. The extraction zone for the Chandra data is an ellipse of 33′′ × 47′′ semi-axes for the source and a nearby circle of 43′′ radius for the background. The ROSAT HRI and PSPC extraction zones consist of circles of 1′ and 3.5′, respectively, centred on the source and surrounding annuli with outer radii of 2′ and 5′ for the background. The minimum numbers of counts per bin for the Chandra and ROSAT mission are 10 cts/bin and 15 cts/bin.
2.2. Optical spectroscopy
WR 138 was monitored with the Aurélie spectrograph (Gillet et al. 1994) at the 1.52 m telescope of the Observatoire de Haute-Provence (OHP) during two observing campaigns in September 2011 and June 2012. The 2011 data were taken with a 1200 lines mm-1 grating blazed at 5000 Å and cover a wavelength domain from 4453 to 4675 Å with a resolving power of ≃20 000. The 2012 spectra were obtained with a 600 lines mm-1 grating also blazed at 5000 Å. The wavelength domain covered by these data extends from 4448 to 4886 Å with a resolving power of ≃10 000. The detector was an EEV 42-20 CCD with 2048 × 1024 pixels. The data were reduced in the standard way (see Rauw et al. 2003) using the MIDAS software provided by ESO. The optical spectrum of WR 138 consists of many strong and broad emission lines with only very few line-free regions. We normalized the spectra of each campaign using a number of (pseudo) continuum windows. Given the different spectral ranges of the two datasets and especially in view of the narrow spectral range of the 2011 data, it was not possible to normalize both datasets consistently. Nevertheless, within a given dataset, the normalizations are consistent, allowing us to search for line-profile variability. In the time of August to September 2012, we furthermore collected a series of échelle spectra of WR 138 with the ESPRESSO spectrograph mounted on the 2.12 m telescope at the Observatorio Astronómico of San Pedro Mártir (SPM) in Mexico. These data cover the spectral region from 3900 to 7200 Å with a resolving power of ≃18 000. The integration times of individual spectra was 15 min. The data were reduced using the IRAF échelle packages. Due to the strongly peaked blaze of the ESPRESSO spectrograph and the broad spectral lines of the WR star, the normalization of the spectra was very difficult. Therefore, we used the SPM data mainly for measuring RVs and for classification purposes.
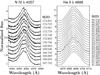 |
Fig. 1 Line-profile variations for the SPM (left) and OHP 2012 (right) observations. The observations are vertically shifted by 0.2 (left) and 0.4 (right) continuum units for clarity (time is given as HJD–2 456 000). |
3. Optical spectra
The OHP spectra display several emission lines: N iii λλ 4510-4534 and 4634-4640; N v λλ 4604 and 4620; He ii λλ 4542, 4686, 4859, and H β. They also display one absorption line: He i λ 4471. We first performed a temporal variation spectrum (TVS, see Fullerton et al. 1996) analysis on these spectra and found that three regions were variable: the N iii λλ 4510-4534 complex, the He ii λ 4686 line, and the He ii λ 4859 + H β blend. The He ii λ 4686 line presents the strongest variations, especially in the core of the line. These variations are clearly visible and take the form of changing subpeaks in the line core with a timescale of a few hours to days, as can be seen in Fig. 1. The H β region displays the weakest variation, which is at the limit of the significance level (at 1%). The variations of these emission lines are reminiscent of those of other WR stars. They are commonly attributed to wind inhomogeneities (clumps) and more specifically to the statistical fluctuation of the number of clumps emitting at a specific line-of-sight velocity (see e.g. Lépine et al. 1996; 1999).
The SPM spectra were mainly used for RV measurements and spectral-type determination. We studied the same emission lines as in the OHP data plus the N iv λ 4058 and He ii λλ 4100 and 4200 lines, as well as two more absorption lines (He i λλ 4143 and 4921). The lines in the SPM spectra also present line profile variations that are clearly visible in Fig. 1. We determined the spectral type of WR 138 using the criteria of Smith et al. (1996). We found that the peak-over-continuum ratios of N v λ 4604 over N iii λ 4640, He ii λ 5411 over He i λ 5875, C iv λ 5808 over He ii λ 5411, and C iv λ 5808 over He i λ 5875 are equal to ~1.05, ~1.57, ~0.80, and ~1.25, respectively, which corresponds to a spectral type between WN5 and WN6. Annuk (1990) and Lamontagne et al. (1982) found a WN6 spectral type using the old criterion of Smith (1968). Adopting this old criterion, we also derive a WN6-type. We therefore classify WR 138 as a WN5-6 star. Annuk (1990) suggested an O9-9.5 I-II type for the companion, with a high rotational velocity vsini ~ 500 km s-1. This high rotational velocity would be unusual for a bright giant or supergiant in a well-detached binary system. Unfortunately, we cannot refine this classification because our data do not allow us to clearly identify a sufficient number of lines belonging to the OB companion.
3.1. Radial velocities
As mentioned above, several scenarios have been proposed concerning the multiplicity of WR 138. Massey (1980) favoured a single-star scenario, whilst Lamontagne et al. (1982) suggested that it might be a triple system with a WR + O system in a wide orbit and a compact object closely orbiting the WR star. Finally, Annuk (1990) concluded that the system consists of only of a WR + O pair in a wide orbit. To determine whether a compact companion is present close to the WR star, we performed an RV analysis on the basis of several lines. We used the above-mentioned spectral lines except for the N iii lines and N v λ 4620, which were too blended to provide accurate measurements. We stress that the lines are very broad and shallow and therefore lead to quite large uncertainties on the RVs. Moreover, as pointed out above, several lines present profile variations that make the RV measurement more difficult. Using the MIDAS software, we fitted Gaussians to the lines, starting from various heights above the continuum, to determine their centroid, and for this we computed the corresponding RVs. The RVs quoted in the present paper are expressed in the heliocentric standard of rest (by applying appropriate RV corrections). The RVs reported in Tables 2−5 correspond to the mean value obtained for each series of measurements performed for each spectral line1.
We note that the He i λλ 4143 and 4921 absorption lines have positive mean RVs, whilst the He i λ 4471 absorption line has a negative mean RV. The He i λ 4471 line also presents a strong variation compatible with the motion of a probable secondary component. For example, the mean RVs of He i λ 4471 change from 36 (OHP 2011) to −44 (OHP 2012) and −26 (SPM 2012) km s-1, while the mean RVs of He ii λ 4542 change from 36 to 85 and 85 km s-1, respectively (the error is of the order of ± 10 km s-1).
It is also interesting to note that the N iv λ 4058 emission line has a negative mean RV, whilst all the other emission lines have positive mean RVs. Several WN-type stars display such differences between velocities of N iv λ 4058 and other lines such as He ii λ 4686 (see e.g. Shylaja 1987). This can most probably be interpreted in terms of different formation sites, from close to the stellar surface to farther out in the wind.
We used our spectral time-series to search for the presence of a compact object in a close orbit. We first tried without success to fit a sine function to the series of RVs with the period of 2.3238 d proposed by Lamontagne et al. (1982). We then applied the generalized Fourier technique developed by Heck et al. (1985), which was refined by Gosset et al. (2001), to the RV time-series obtained from OHP and SPM data. The power spectrum did not present a significant peak in the frequency domain that would have been compatible with such a short period (see Fig. 2). In conclusion, we did not find evidence for a short period in the WR 138 system. We suggest that the line profile variations previously mentioned may be responsible for stochastic RV variations, which could have been mistaken for periodic changes.
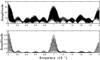 |
Fig. 2 Uppper panel: power spectrum computed on the basis of the RVs of the N v λ 4604 line. Lower panel: associated spectral window. |
Our data were obtained over a time basis that is too short to investigate time-scales as
long as 1500 d. We therefore complemented our time-series with the measurements published
by Massey (1980), Lamontagne et al. (1982), and Annuk (1990). We selected the spectral lines common to all studies. Even though this
time-series is sparse and not homogeneous in terms of spectral resolution and
signal-to-noise ratio, it offers the advantage of covering several decades. We caution,
however, that the errors on the older measurements cannot be quantified, and neither do we
have any information on the rest-wavelengths2 used
by previous authors to compute their RVs. Systematic biases are therefore possible. The
results of the Fourier analysis of this extended time-series are interesting, however,
because the power spectrum is clearly dominated by a peak at 6.5 × 10⁻⁴
d-1 for the N iv λ 4058 (see Fig. 3) and He ii λ 4542 lines. For
the He ii λ 4686 and N v λ 4604 lines,
the highest peaks are found at frequencies of 6.6 × 10⁻⁴ and
6.7 × 10⁻⁴d-1. These peaks correspond to periods of 1538.5,
1515.2, and 1492.5 d. We estimate the uncertainty on the period as
 , where ΔT is the time
interval between the first and the last observations of the complete time-series (assuming
the uncertainty on the peak frequency amounts to 20% of the peak width), giving a value of
~35 d. In conclusion, we thus argue that WR 138 is a binary system with a period of
1521.2 ± 35 d, which agrees quite well with the value derived by Annuk (1990, P = 1538 d).
, where ΔT is the time
interval between the first and the last observations of the complete time-series (assuming
the uncertainty on the peak frequency amounts to 20% of the peak width), giving a value of
~35 d. In conclusion, we thus argue that WR 138 is a binary system with a period of
1521.2 ± 35 d, which agrees quite well with the value derived by Annuk (1990, P = 1538 d).
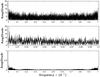 |
Fig. 3 Uppper and middle panels: power spectrum computed on the basis of the RVs of the N iv λ 4058 line. The peak lies at 6.5 × 10⁻⁴d-1, which corresponds to a period of 1538.5 d. Lower panel: associated spectral window (the highest value, 1, lies at ν = 0). |
4. X-ray emission
4.1. Spectral fits
To determine the nature of the system, we fitted several models to the EPIC spectra. Very few individual lines are visible, which is due to the low resolution. The fits were calculated with the XSPEC software, v 12.6.0 (Arnaud 1996). Our spectra present the highest emission peak around 0.8−1 keV, but extend to more or less 8 keV, which is quite high assuming a (single) O-type star, but is more typical of a colliding-wind binary. The X-ray emission of an individual massive star can be, in first approximation, described by an optically thin thermal plasma heated to a few 106 K by shocks intrinsic to its stellar wind (Feldmeier et al. 1997; Lucy & White 1980; Lucy 1982; Owocki et al. 1988). Whether or not the same mechanism also operates in the winds of individual WR stars is currently still an open question. In fact, unlike O-type stars, single WRs do not exhibit a clear relation between their X-ray luminosity and their stellar wind parameters (Wessolowski 1996). While some (apparently) single WR stars are detected as X-ray sources, others remain undetected, even with XMM-Newton and Chandra (e.g. Oskinova 2003; Gosset et al. 2005; Skinner et al. 2010; 2012). In the case of a WR+OB binary system, an additional site for thermal X-ray production is the colliding-wind region, where strong shocks can heat the plasma to temperatures of several 107 K (Pittard & Parkin 2010). In addition, a power-law component may be required to account for a possible inverse-Compton-scattering emission that can occur in the wind-collision region (De Becker 2007). Finally, a combination of an optically thin thermal plasma and a black-body emission can be considered in the case of a WR + neutron star system. We investigated all these models, restricting our analyses to the energy range 0.3−10 keV to avoid data with very low S/N ratio. In the third XMM-Newton observation, WR 138 partially fell in a gap of the pn detector. We tried to fit the data, but the results obtained with this set give a very poor quality fit. To avoid a misinterpretation, we therefore decided to reject these pn data. We adopted an equivalent interstellar column of neutral hydrogen of NH,ism = 0.58 × 10²²E(B−V) = 0.37 × 1022 cm-2 (Bohlin et al. 1978) using the star’s colour excess obtained from E(B−V) = 1.21/4.1 Av = 0.63 mag (van der Hucht 2001). WR stars are evolved objects and are characterized by non-solar abundances. We therefore used models with adjustable abundances. However, in view of the low spectral resolution, we had to reduce the number of free parameters to avoid local minima or non-physical solutions. We therefore fixed the abundances to common values for WN stars found in the literature (Crowther et al. 1993; Hamann & Koesterke 1998; Hamann & Gräfener 2004). These cases correspond to a H/He ratio equal to 0.05, 0.15, and 0.25. The C/He, N/He, and O/He are equal to 0.00048, 0.048, and 0, while all other elements were kept fixed to their solar value. Table 6 recalls the relative abundances adopted for the different chemical elements.
Relative and solar abundances used for the X-ray spectral modelling.
Best-fit parameter results for the two-temperature plasma model.
We first tried a single-temperature plasma model (APEC) and an intrinsic absorption column. As expected, this simple model gives poor quality fits, and therefore we switched to a more complex two-temperature model with an intrinsic absorption column (wabsISM*wabs*(APEC+APEC)). We point out that the absorption is dominated by the interstellar absorption, therefore we used a wabs model with solar abundances (Anders & Ebihara 1982) instead of a vphabs model with non-solar abundances. The two models led to solutions with similar reduced χ2, temperatures, normalization factors, and a low NH. The three sets of non-solar abundances yielded solutions with similar reduced χ2, temperatures, and intrinsic absorption column. The normalization factors were different, however, which is expected because in modifying the relative abundances, we changed the number of available free electrons and hence the emission measure of the plasma. We therefore adopted the intermediate value of the abundance for the rest of the study (i.e. H/He = 0.15). Table 7 gives a summary of the best-fit parameters. If we simultaneously fit the data from the two detectors (except for the third observation where the pn data were rejected), the results of the fits suggest a weaker variability than in the case of the fits of the MOS 2 data alone.
We also used a one-temperature plasma plus a power-law model with an intrinsic absorption
column (wabsISM*wabs*(APEC+power-law)). The quality of the fit is similar to
those obtained with the previous model except for the third observation, for which this
model gives a better fit. Notice that the poorer response at energy <0.5 and >5 keV
mainly explains the high χ2 of the 2-T plasma and the 1-T
plasma plus power-law model fit. Table 8 gives a
summary of the best-fit parameters. Because of the low S/N ratio above 2 keV, it is
difficult to determine which of these models is best-suited to the WR 138 system. It has
to be stressed that the photon index and normalization of the power-law component are
found to be highly variable in this model. In particular, we had to deal with multiple
local minima that severely affected our capability to derive consistent parameters from
one data set to the other. It is clear, for instance, that the fit in some cases predicted
excessive normalization parameter values, which were therefore accompanied by large
absorption columns to compensate the flux excess at lower energies. This probably points
to a significant inadequacy of the 1T+power-law model. Finally, the APEC plus black-body
model gives low-quality fits ( ).
).
X-ray flux.
In conclusion, the two-temperature plasma model seems to be the most adequate one. This model is dominated by the lowest temperature at 0.6 keV. Hamann et al. (1995) reported a luminosity of log Lbol = 38.9 (assuming a photometric distance of d = 1.82 kpc, Lundström & Stenholm 1984) for WR 138, which is well inside the range of values of the other WN5-6 stars, that is, log Lbol = [38.5,39.2]. The X-ray luminosity that we derive with the distance used by Hamann et al. (1995) is about log Lx = 32.65. With this value, we can derive a log (Lx/Lbol) ratio of −6.25. Oskinova (2005) suggested a distance of d = 1.26 kpc and a log Lbol = 38.88. With this distance and bolometric luminosity, the X-ray luminosity lies in the range log Lx = [32.33,32.48], which leads to a log (Lx/Lbol) = [−6.55,−6.41].
The X-ray analysis shows that WR 138 is no exceptional star in this wavelength domain. Oskinova (2005) reported on other WN+OB star binaries whose spectra could be represented by a two-temperature plasma model dominated by a soft component kT1 ≈ 0.6 keV and a hard component kT2 ≈ 2 keV. Our modelling agrees well for the temperature of the soft component, but gives a sightly lower value for the temperature of the hard component.
Our results (moderate X-ray luminosity, X-ray spectral morphology) argue against the presence of an accreting compact companion. They instead suggest a more conventional long-period WR + OB binary.
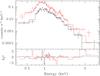 |
Fig. 4 Top panel: spectra (MOS2, in black, and pn, in red, instrument) of the XMM-Newton observation of HJD = 2 455 694.768 and best-parameter fit obtained with XSPEC. Lower panel: χ2 increments multiplied by the sign of the data – model difference. |
4.2. Long-term behaviour
Several pointed observations from Swift, ROSAT, and Chandra (see Sect. 2.1) were also used to determine whether WR 138 presents long-term variations in its X-ray emission. Such long-term variations exist in long-period highly eccentric WN + OB colliding wind binaries (e.g. WR 22, Gosset et al. 2009; WR 25, Pollock & Corcoran 2006). We also fitted the two-temperature plasma model and the one-temperature plus power-law model to the ROSAT and Chandra data. For the ROSAT data, the spectra have a very low resolution and do not cover the energies beyond 2.2 keV. A fit of the data without fixing the temperature gives unrealistically high temperatures (kT > 10 keV). Therefore, we fixed the temperature to the mean value of the XMM-Newton best-fit temperatures. For the Chandra data, we tried to fit the data with or without fixed temperatures. In the first case (fixed temperatures), the normalization factors (and intrinsic absorption) are similar to the XMM-Newton fits. In the second case (no fixed temperature), the fit indicates slightly lower temperatures. These slight differences could be due to remaining cross-calibration uncertainties. The best-fit parameters are given in Tables 7 and 8.
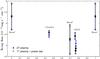 |
Fig. 5 Variation of the observed X-ray fluxes derived with XSPEC for the ROSAT, Chandra, and XMM-Newton observations in the energy band 0.5−2 keV. 1ROSAT observation 2 446 928.585, 2ROSAT observation 2 449 508.604. The phase 0 has been arbitrary chosen to the oldest ROSAT observation. We did not use the T0 derived by Annuk (1990) because they strongly depend on the line considered. The period has been fixed to P = 1521.1 d. Error bars are related to the relative error of the count rate (see text). |
From these fits, we computed the X-ray fluxes in three spectral bands: soft (0.5−1.0 keV), medium (1.0−2.0 keV), and hard (2.0−10.0 kev). These fluxes are quoted in Table 9. We assumed that the relative error on the observed X-ray fluxes is the same as for the count rates, and chose the oldest ROSAT observation as the starting point for arbitrary ephemeris (using the P = 1521.1 d period found in Sect. 3). The error estimate is probably underestimated because some parameters such NH,ism are poorly known. The flux also strongly depends on the model used, which is affected by uncertainties. These additional errors are unfortunately difficult to estimate. We tried to use the flux err command of XSPEC to calculate another evaluation of the error. The results are of the same order of magnitude (few percent) for the upper limit. The lower limit derived from XSPEC is much lower, but a model computed from this lower limit cannot account for the observed flux. Figure 5 shows that WR 138 displays only modest, if any, flux variations, although because of the uncertainties on the long-term orbital solution, it is not clear whether or not our data sample critical phases (such as the periastron passage) of the orbital motion in the WN5-6 + OB binary. A dedicated monitoring of WR 138 around periastron might reveal a significant increase in flux. However, this requires an accurate ephemeris and needs a dedicated and long-term optical monitoring of WR 138.
X-ray count rates.
Table 10 gives the value of the count rates given by XSPEC for the different missions (observed count rates) and those simulated with XSPEC using the model parameters of a simultaneous fit of all XMM-Newton spectra with a two-temperature plasma model (simulated count rates) folded through the appropriate instrumental response matrices. We stress that the count rates are those within the extraction regions and are therefore depending on where the source lies on the detector and the size of chosen regions; consequently, they are linked to the ancillary response files (arf). Because the exposure time and arf are different for each observation, we see small differences in the simulated count rates of the same instruments. The comparison between observed and simulated count rate is aimed at providing an estimate of the potential long-term variations between the epoch of the XMM-Newton observations and that of all previous observations. The count rates of the three XMM-Newton observations present variations of less than 10%, that is, less than 3-σ except for the first pn observation (see Table 10). The first MOS2 observation also presents a quite high variation that is just below 3-σ. Therefore there is no contradiction between the pn and MOS2 results. The oldest ROSAT PSPC and HRI observations also display count-rate variations stronger than 3-σ, which are therefore considered to be significant.
5. Summary and conclusion
Throughout this paper we have investigated the validity of a scenario where the WR 138 system harbours a close compact companion. We found that neither the optical spectra nor the X-ray spectra analysis provided clear clues for such a companion.
The optical campaigns have shown that, as for many WR stars, the broad emission lines of WR 138 display variable subpeaks (Lépine et al. 1996, see Fig. 1) that might affect the determination of the RV of the WN star. The Fourier analyses of RVs do not show any clear short period compatible with that derived by Lamontagne et al. (1982). Photometric studies have also been conducted by Martin & Plummer (1919), Gaposchkin (1946), and Ross (1961), who first reported on the low-level irregular variability of WR 138, and a photometric period of 11.6 d was reported by Moffat & Shara (1986). However, these results are based on limited and sparse time-series that are not adequate for distinguishing between periodic and sporadic variations such as are frequently found in photometric observations of WR stars (e.g. Gosset et al. 1994). Indeed, from the longer-term Hipparcos photometry of WR 138, Marchenko et al. (1998) reported on stochastic variability. The X-ray analysis seem to point in the same direction, that is, the absence of a compact companion. Indeed, the luminosity of WR 138 lies in the range log Lx = [32.33,32.48], while the luminosity of the Cyg X-3 system (log Lx ~ 1038 ergs-1, Skinner et al. 2010), which is the best-known system including a compact companion that accretes the wind material from a WR star, is several orders of magnitude higher.
The question of a long-period OB companion has also been raised. The presence of this OB companion is now ascertained and supported by both optical and X-ray analyses. The Fourier analysis of the new RVs added to the previously reported ones of Massey (1980), Lamontagne (1982), and Annuk (1990) clearly reveals a peak associated to a long period. Moreover, the variations of the measured RVs cannot be completely explained by intrinsic wind inhomogeneities. The most probable scenario is that WR 138 is composed of a WN 5-6 star with an OB-type companion in a wide eccentric orbit of about 1521 d.
The X-ray spectra present an extension to high energies that would be unusual for single-star emission, but which is more common for a long-period system. The typical X-ray luminosity of WN-type stars displays large scatter. For example, WR 25 displays an X-ray luminosity of log Lx = 33.9, while some other stars remain below detection level (log Lx < 30.0, Oskinova 2005), such as WR 40 (log Lx < 31.6, Gosset et al. 2005). Oskinova (2005) reported that the typical value of log (Lx/Lbol) is ~−7. Our results (log Lx = [32.33,32.48] and log (Lx/Lbol) = [−6.55,−6.41]) allow us to conclude that WR 138 is not particularly luminous in X-rays, but it is not particularly faint either. In fact, WR 138 seems to lie in the mean range of what we can observe for WN-type stars. This moderate X-ray luminosity also agrees well with a companion in a wide orbit. Skinner et al. (2010; 2012) and Oskinova (2005) also suggested that a two-temperature plasma model reproduces the spectra of a WN+OB binary system well. Our best-fit parameter again agrees well with this suggestion.
We also noticed variation in the X-ray emission, but, because of the small number of observations, we cannot deduce a phase-locked variability, but we cannot exclude that the variation is due to a weak wind-wind interaction between the WN 5-6 and an OB companion. Finally, the radio emission of WR 138 was reported to be thermal by Montes et al. (2009) with a corresponding mass-loss rate of 1.18 × 10⁻⁵ M⊙ yr-1 (assuming a distance of 1.4 kpc). Montes et al. (2009) inferred a radio spectral index close to unity, higher than expected for the free-free emission of the wind of a single star. These authors suggested that this might reflect either a clumpy wind or be due to a radiative-wind interaction zone in a binary system, which agrees well with the scenario of a WN+OB companion.
In conclusion, we can confidently reject the scenario of a compact companion in a close orbit around the WN star because no clues (level of X-ray emission, lack of short-term RV variations) support this assumption. The OB companion proposed by Annuk (1990) can be confirmed by both optical analysis (RV variations, peak in Fourier analysis) and X-ray analysis (moderate luminosity, extension of the spectra to high energies, variations). Finally, the orbital period can be refined to P = 1521.2 ± 35 d.
Online material
Radial velocities (in km s-1) measured for the OHP 2011 campaign.
The rest-wavelengths used in this paper come from the NIST Atomic Spectra Database available at: http://www.nist.gov/pml/data/asd.cfm.
Acknowledgments
We acknowledge support through the XMM/INTEGRAL PRODEX contract (Belspo), from the Fonds de Recherche Scientifique (FRS/FNRS), and CONACYT grant.
References
- Anders, E., & Ebihara, M. 1982, Geochim. Cosmochim. Acta, 46, 2363 [NASA ADS] [CrossRef] [Google Scholar]
- Annuk, K. 1990, Acta Astron., 40, 267 [Google Scholar]
- Arnaud, K. A. 1996, in Astronomical Data Analysis Software and Systems V, XSPEC: The First Ten Years, eds. G. H. Jacoby, & J. Barnes, ASP Conf. Ser., 101, 17 [Google Scholar]
- Bohlin, R. C., Savage, B. D., & Drake, J. F. 1978, ApJ, 224, 132 [NASA ADS] [CrossRef] [Google Scholar]
- Crowther, P. A., Smith, L. J., & Hillier, D. J. 1993, Space Sci. Rev., 66, 271 [NASA ADS] [CrossRef] [Google Scholar]
- De Becker, M. 2007, A&AR, 14, 171 [NASA ADS] [CrossRef] [Google Scholar]
- Feldmeier, A., Puls, J., & Pauldrach, A. W. A. 1997, A&A, 322, 878 [NASA ADS] [Google Scholar]
- Fullerton, A. W., Gies, D. R., & Bolton, C. T. 1996, ApJS, 103, 475 [NASA ADS] [CrossRef] [Google Scholar]
- Gaposchkin, S. 1946, Publ. AAS, 10, 250 [Google Scholar]
- Gillet, D., Burnage, R., Kohler, D., et al. 1994, A&AS, 108, 181 [NASA ADS] [Google Scholar]
- Grevesse, N., & Sauval, A. 1998, Space Sci. Rev., 85, 161 [NASA ADS] [CrossRef] [Google Scholar]
- Gosset, E., Rauw, G., Manfroid, J., Vreux, J.-M., & Sterken, C. 1994, in The Impact of Long-Term Monitoring on Variable Star Research, eds. C. Sterken, & M. de Groot (Dordrecht: Kluwer), 436, 101 [Google Scholar]
- Gosset, E., Royer, P., Rauw, G., Manfroid, J., & Vreux, J.-M. 2001, MNRAS, 327, 435 [NASA ADS] [CrossRef] [Google Scholar]
- Gosset, E., Nazé, Y., Claeskens, J.-F., et al. 2005, A&A, 429, 685 [NASA ADS] [CrossRef] [EDP Sciences] [Google Scholar]
- Gosset, E., Nazé, Y., Sana, H., Rauw, G., & Vreux, J.-M. 2009, A&A, 508, 805 [NASA ADS] [CrossRef] [EDP Sciences] [Google Scholar]
- Hamann, W.-R., & Gräfener, G. 2004, A&A, 427, 697 [NASA ADS] [CrossRef] [EDP Sciences] [Google Scholar]
- Hamann, W.-R., & Koesterke, L. 1998, A&A, 335, 1003 [NASA ADS] [Google Scholar]
- Hamann, W.-R., Koesterke, L., & Wessolowski, U. 1995, A&A, 299, 151 [NASA ADS] [Google Scholar]
- Heck, A., Manfroid, J., & Mersch, G. 1985, A&AS, 59, 63 [NASA ADS] [Google Scholar]
- Jansen, F., Lumb, D., Altieri, B., et al. 2001, A&A, 365, L1 [NASA ADS] [CrossRef] [EDP Sciences] [Google Scholar]
- Lamontagne, R., Moffat, A. F. J., Koenigsberger, G., & Seggewiss, W. 1982, ApJ, 253, 230 [NASA ADS] [CrossRef] [Google Scholar]
- Lépine, S., & Moffat, A. F. J. 1999, ApJ, 514, 909 [NASA ADS] [CrossRef] [Google Scholar]
- Lépine, S., Moffat, A. F. J., & Henriksen, R. N. 1996, ApJ, 466, 392 [NASA ADS] [CrossRef] [Google Scholar]
- Lucy, L. B. 1982, ApJ, 255, 286 [NASA ADS] [CrossRef] [Google Scholar]
- Lucy, L. B., & White, R. L. 1980, ApJ, 241, 300 [NASA ADS] [CrossRef] [Google Scholar]
- Lundström, I., & Stenholm, B. 1984, A&AS, 58, 163 [NASA ADS] [Google Scholar]
- Marchenko, S. V., Moffat, A. F. J., van der Hucht, K. A., et al. 1998, A&A, 331, 1022 [NASA ADS] [Google Scholar]
- Martin, C., & Plummer, H. C. 1919, MNRAS, 79, 196 [NASA ADS] [Google Scholar]
- Massey, P. 1980, ApJ, 236, 526 [NASA ADS] [CrossRef] [Google Scholar]
- Moffat, A. F. J., & Shara, M. M. 1986, AJ, 92, 952 [NASA ADS] [CrossRef] [Google Scholar]
- Moffat, A. F. J., Lamontagne, R., Shara, M. M., & McAlister, H. A. 1986, AJ, 91, 1392 [NASA ADS] [CrossRef] [Google Scholar]
- Montes, G., Pérez-Torres, M. A., Alberdi, A., & González, R. F. 2009, ApJ, 705, 899 [NASA ADS] [CrossRef] [Google Scholar]
- Negueruela, I. 2010, in High Energy Phenomena in Massive Stars, ASP Conf. Ser., 422, 57 [Google Scholar]
- Oskinova, L. M. 2005, MNRAS, 361, 679 [NASA ADS] [CrossRef] [Google Scholar]
- Oskinova, L. M., Ignace, R., Hamann, W.-R., Pollock, A. M. T., & Brown, J. C. 2003, A&A, 402, 755 [NASA ADS] [CrossRef] [EDP Sciences] [Google Scholar]
- Owocki, S. P., Castor, J. I., & Rybicki, G. B. 1988, ApJ, 335, 914 [NASA ADS] [CrossRef] [Google Scholar]
- Pittard, J. M., & Parkin, E. R. 2010, MNRAS, 403, 1657 [NASA ADS] [CrossRef] [Google Scholar]
- Pollock, A. M. T. 1987, ApJ, 320, 283 [NASA ADS] [CrossRef] [Google Scholar]
- Pollock, A. M. T., & Corcoran, M. F. 2006, A&A, 445, 1093 [NASA ADS] [CrossRef] [EDP Sciences] [Google Scholar]
- Pollock, A. M. T., Haberl, F., & Corcoran, M. F. 1995, in Wolf-Rayet Stars: Binaries, Colliding Winds, Evolution, eds. K. A. van der Hucht, & P. M. Williams (Dordrecht, Kluwer), 512 [Google Scholar]
- Rauw, G., De Becker, M., & Vreux, J.-M. 2003, A&A, 399, 287 [NASA ADS] [CrossRef] [EDP Sciences] [Google Scholar]
- Ross, L. W. 1961, PASP, 73, 354 [NASA ADS] [CrossRef] [Google Scholar]
- Shylaja, B. S., 1987, JApA, 8, 183 [NASA ADS] [Google Scholar]
- Skinner, S. L., Zhekov, S. A., Güdel, M., Schmutz, W., & Sokal, K. R. 2010, AJ, 139, 825 [NASA ADS] [CrossRef] [Google Scholar]
- Skinner, S. L., Zhekov, S. A., Güdel, M., Schmutz, W., & Sokal, K. R. 2012, AJ, 143, 116 [NASA ADS] [CrossRef] [Google Scholar]
- Smith, L. F. 1968, MNRAS, 138, 109 [NASA ADS] [CrossRef] [Google Scholar]
- Smith, L. F., Shara, M. M., & Moffat, A. F. J. 1996, MNRAS, 281, 163 [NASA ADS] [CrossRef] [Google Scholar]
- Strüder, L., Briel, U., Dennerl, K., et al. 2001, A&A, 365, L18 [NASA ADS] [CrossRef] [EDP Sciences] [Google Scholar]
- Turner, M. J. L., Abbey, A., Arnaud, M., et al. 2001, A&A, 365, L27 [NASA ADS] [CrossRef] [EDP Sciences] [Google Scholar]
- van der Hucht, K. A. 2001, New Astron. Rev., 45, 135 [NASA ADS] [CrossRef] [Google Scholar]
- Vreux, J.-M. 1985, PASP, 97, 274 [NASA ADS] [CrossRef] [Google Scholar]
- Wessolowski, U. 1996, in Röntgenstrahlung from the Universe (MPE Report 263), eds. H. U. Zimmerman, J. E. Trümper, & H. York (Garching: MaxPlanck-Inst. für Extraterrestrische Physik), 75 [Google Scholar]
All Tables
All Figures
|
Fig. 1 Line-profile variations for the SPM (left) and OHP 2012 (right) observations. The observations are vertically shifted by 0.2 (left) and 0.4 (right) continuum units for clarity (time is given as HJD–2 456 000). |
| In the text | |
|
Fig. 2 Uppper panel: power spectrum computed on the basis of the RVs of the N v λ 4604 line. Lower panel: associated spectral window. |
| In the text | |
|
Fig. 3 Uppper and middle panels: power spectrum computed on the basis of the RVs of the N iv λ 4058 line. The peak lies at 6.5 × 10⁻⁴d-1, which corresponds to a period of 1538.5 d. Lower panel: associated spectral window (the highest value, 1, lies at ν = 0). |
| In the text | |
|
Fig. 4 Top panel: spectra (MOS2, in black, and pn, in red, instrument) of the XMM-Newton observation of HJD = 2 455 694.768 and best-parameter fit obtained with XSPEC. Lower panel: χ2 increments multiplied by the sign of the data – model difference. |
| In the text | |
|
Fig. 5 Variation of the observed X-ray fluxes derived with XSPEC for the ROSAT, Chandra, and XMM-Newton observations in the energy band 0.5−2 keV. 1ROSAT observation 2 446 928.585, 2ROSAT observation 2 449 508.604. The phase 0 has been arbitrary chosen to the oldest ROSAT observation. We did not use the T0 derived by Annuk (1990) because they strongly depend on the line considered. The period has been fixed to P = 1521.1 d. Error bars are related to the relative error of the count rate (see text). |
| In the text | |
Current usage metrics show cumulative count of Article Views (full-text article views including HTML views, PDF and ePub downloads, according to the available data) and Abstracts Views on Vision4Press platform.
Data correspond to usage on the plateform after 2015. The current usage metrics is available 48-96 hours after online publication and is updated daily on week days.
Initial download of the metrics may take a while.