| Issue |
A&A
Volume 560, December 2013
|
|
|---|---|---|
| Article Number | A23 | |
| Number of page(s) | 16 | |
| Section | Catalogs and data | |
| DOI | https://doi.org/10.1051/0004-6361/201322144 | |
| Published online | 29 November 2013 | |
Exploring the bulk of the BL Lacertae object population
I. Parsec-scale radio structures⋆
1 INAF – Istituto di Radioastronomia, via Gobetti 101, 40129 Bologna, Italy
e-mail: liuzzo@ira.inaf.it
2 Dipartimento di Fisica e Astronomia, Università di Bologna, via Ranzani 1, 40127 Bologna, Italy
3 Max Planck Institute for Radioastronomy, Auf dem Hügel 69, 53121 Bonn, Germany
4 INAF-Osservatorio Astronomico di Brera, via Brera 28, 20121 Milano, Italy
5 Università degli Studi dell’Insubria, via Valleggio 11, 22100 Como, Italy
6 Department of Physics and Astronomy, University of New Mexico, Albuquerque NM 87131, USA
7 Instituto de Astrofisica de Andalucia, CSIC, Apartado 3004, 18080 Granada, Spain
8 Universität Würzburg¨, Lehrstuhl für Astronomie, Emil-Fischer-Str. 31, 97074 Würzburg, Germany
9 Dipartimento di Fisica, Università degli Studi di Perugia, 06123 Perugia, Italy
Received: 25 June 2013
Accepted: 11 September 2013
Context. The advent of Fermi is changing our understanding on the radio and γ-ray emission in active galactic nuclei. Unlike pre-Fermi ideas, BL Lac objects are found to be the most abundant emitters in the γ-ray band. However, since they are relatively weak radio sources, most of their parsec-scale structure and their multifrequency properties are poorly understood and/or have not been investigated in a systematic fashion.
Aims. Our main goal is to analyze the radio and γ-ray emission properties of a sample of 42 BL Lacs selected, for the first time in the literature, with no constraint on their radio and γ-ray emission.
Methods. Thanks to new Very Long Baseline Array observations at 8 and 15 GHz for the whole sample, we present fundamental parameters here such as radio flux densities, spectral index information, and parsec-scale structure. Moreover, we search for γ-ray counterparts using data reported in the Second Catalog of Fermi Gamma-ray sources.
Results. Parsec-scale radio emission is observed in the majority of the sources at both frequencies. Gamma-ray counterparts are found for 14/42 sources.
Conclusions. The comparison between our results in radio and gamma-ray bands points out the presence of a large number of faint BL Lacs showing “non-classical” properties such as low source compactness, core dominance, no gamma-ray emission, and steep radio spectral indexes. A deeper multiwavelength analysis will be needed.
Key words: radio continuum: galaxies / galaxies: active / galaxies: jets
The calibrated uv and FITS files are available at the CDS via anonymous ftp to cdsarc.u-strasbg.fr (130.79.128.5) or via http://cdsarc.u-strasbg.fr/viz-bin/qcat?J/A+A/560/A23
© ESO, 2013
1. Introduction
Based on results from the Energetic Gamma-Ray Experiment Telescope (EGRET) on the Compton Gamma-Ray Observatory (CGRO), it is well known that the main contribution to the γ-ray sky comes from the Galactic plane emission, pulsars, and blazars (Hartman et al. 1999). Among the last class of objects, flat spectrum radio quasars (FSRQs) were the most numerous compared to the BL Lac objects, making up 77% of the high-confidence blazar associations.
With the advent of the Fermi mission, studies of a large number of γ-ray sources have become possible thanks to the unprecedented sensitivity of the Large Area Telescope (LAT, Atwood et al. 2009). Moreover, the improved point spread function of the LAT significantly improved the localization of the γ-ray sources with respect to the past γ-ray missions. In contrast to the previous EGRET results, the LAT has shown that the BL Lacs and not the FSRQs are now the most common γ-ray emitters (1LAC, Abdo et al. 2010; 2LAC, Ackermann et al. 2011a,b): in the Clean 2 LAC Sample, 395 are BL Lac objects, 310 FSRQs, 157 sources of unknown type, 22 other AGNs, and 2 starburst galaxies (Ackermann et al. 2011a,b). Moreover, the two blazar sub-classes are markedly distinct in the average photon indexes, redshift and flux density distributions. Big questions nevertheless remain open, such as the origin and location of γ-rays, the distance of the main energy dissipation site from the nucleus, and the relation between the γ-ray and radio emission.
BL Lac objects belong to the blazar population showing a high core dominance, high degrees of variability and polarization, and one-sided Doppler beamed parsec-scale jets. However, they present properties that are quite different from those of FRSQs: lower apparent velocities (Gabuzda et al. 1994; Jorstad et al. 2001; Kellermann et al. 2004; Lister et al. 2009a,b), also in the most extreme BL Lacs, the TeV BL Lacs (e.g., MrK 501, Giroletti et al. 2004a,b; MrK 412, Lico et al. 2012; Piner et al. 2004, 2008, 2010); differences in polarization degree (Gabuzda et al. 1999); and rotation measure values in their cores at mas resolution (Hovatta et al. 2012).
Thanks to Fermi findings, the high-energy characteristics of BL Lacs can be investigated, but to understand the origin and the nuclear properties of these sources more information at different frequencies are necessary. Very Long Baseline Interferometer (VLBI) campaigns are one of the most incisive observational tools for addressing the questions opened by the Fermi results. From a detailed literature review (Ros et al. 2011), it is evident that previous VLBI surveys have looked at the parcsec scale properties of the brightest BL Lac objects, while the majority of the BL Lac population is below their flux density limits (Wu et al. 2007; Giroletti et al. 2004b, 2006; Rector et al. 2003; Cassaro et al. 2002). In fact, many LAT BL Lacs are high-frequency-synchrotron-peaked (HSP) sources, discovered at X-rays and generally they are faint radio sources, seldom studied with VLBI. To gain a deeper understanding of BL Lac properties, we selected a sample of low-redshift BL Lacs sources with no selection limits on their radio flux density or high-frequency emission.
In this work, we present our analysis on the radio and γ-ray emission of this sample of nearby BL Lacs. In following papers (Rainò et al., in prep.; Giroletti et al., in prep.), we will discuss these results at multiple wavebands.
The paper is organized as following: in Sect. 2, we introduce our new sample of low-redshift BL Lacs; in Sect. 3, we describe the new high-resolution radio observations performed with VLBI; in Sect. 4, we show the results on the radio properties of the sample; in Sect. 5, we compare the radio and γ-ray emission for these objects.
Throughout this paper, we assume h = 0.71, Ωm = 0.27, and Ωλ = 0.73, where the Hubble constant H0 = 100 h km s-1 Mpc-1. We define radio spectral index α such that the flux density S(ν) ~ ν− α and the gamma photon index Γ is defined as N(E) ∝ E− Γ.
2. The sample
Recently we began a project to improve our knowledge of the BL Lac nuclear region, through VLBI observations of a sample of BL Lacs, independent of their radio flux densities and their γ-ray emission, and with multifrequency information available for all targets. We selected our sample of BL Lacs from the Roma BZCat Catalog of the known blazars (Massaro et al. 2009)1 with two constraints:
-
a measured redshift z < 0.2;
-
BL Lacs located within the sky area covered by the Sloan Digital Sky Survey (SDSS, Abazajian et al. 2009).
We extracted our sample from the BZ Cat because this catalog is the most complete list of published blazars, so it is very suitable for the aims of our project, which requires an unbiased sample with respect to the the radio flux density and gamma-ray emission2. These two selection criteria on the BZ Cat allow us 1) to also investigate the least powerful sources, such as the weak population of HSP BL Lacs, with a good linear resolution (1 pc ~ 0.5 mas at z = 0.1); 2) a good characterization not only of the optical properties, but also of their extended radio characteristics since the Faint Images of the Radio Sky at Twenty-Centimeters (FIRST) cover the same SDSS field.
Log of the new VLBA observations in X and U bands.
The total number of BL Lacs in our sample is 42. The National Radio Astronomy Observatory (NRAO) VLA Sky Survey Catalog (NVSS) flux density distribution for the sources in the sample is shown in Fig. 1. The flux density limits of the Monitoring of jets in active galactic nuclei (AGN) with Very Long Baseline Array (VLBA) Experiments (MOJAVE-1; correlated flux S > 1.5 Jy at 2 cm, Lister et al. 2009a,b) and VLBA Imaging and Polarimetry Survey (VIPS; S > 85 mJy at 5 GHz, Helmboldt et al. 2007) surveys are also plotted (assuming α = 0.0). As Fig. 1 points out, our sample is representative of a population that is the majority of the whole BL Lacs, but it is not explored by two of the most complete previous VLBI surveys.
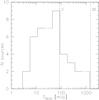 |
Fig. 1 Distribution of the NVSS flux density for the sources in our sample. The dashed lines show the flux density limits of the MOJAVE-1 (M) and VIPS surveys (V), extrapolated assuming α = 0.0. |
3. VLBA observations and data reduction
We observed with the VLBA all sources of our sample (Table 1, project codes BG197A, B and BG204A, B, C). Each target was observed at 8 GHz and 15 GHz with the aim of obtaining simultaneous spectral information. The observing time was about one hour per source, with roughly a 1:3 ratio between the low and high-frequency total integration time. Targets weaker than 50 mJy in NVSS images have been observed in phase reference mode at 15 GHz, while sources weaker than 30 mJy have been observed in phase reference mode at both 8 GHz and 15 GHz. Indeed, most sources had never been observed before with VLBI and the phase referencing technique has also provided the possibility to obtain absolute coordinates for them. We switched between the two frequencies and moved from different targets within each session to obtain good (u,v)-coverage, necessary to properly map complex faint structures. Observations were made with the entire VLBA in full polarization with four intermediate frequencies (IFs). The VLBA correlator produced 16 frequency channels per IF/polarization for a total aggregate bit rate of 256 Mbs. Calibrators were chosen from the VLBA calibrators list to be bright and close to the target sources: in Table 1, we report the list of the selected calibrators. Short scans on strong sources were interspersed with the targets and the calibrators as fringe finders. The observations were correlated in Socorro, New Mexico, USA.
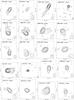 |
Fig. 2 8.4 and 15 GHz VLBA images of resolved BL Lacs. |
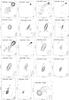 |
Fig. 2 continued. |
Images parameters of 8 GHz and 15 GHz observations.
Parsec-scale morphologies and spectral indexes.
Model-fit results for detected sources.
Kiloparsec and parsec-scale radio properties of the whole sample.
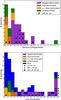 |
Fig. 3 Source compactness (SC, top panel) and core dominance (CD, bottom panel) distributions for the present sample of BL Lacs using the classification given in Sect. 4.3. U.L. indicates that the corresponding values are upper limits. Gamma-ray BL Lacs are reported with black dots. In the CD histogram, we plot sources (all radio galaxies, but 2 BL Lacs) of the Bologna Complete Sample (Liuzzo et al. 2009). Two different symbols are used to represent the three gamma-ray BCS sources: M 87 (star) and 2 BL Lacs (square). Arrows indicate upper- and lower-limit CD values. |
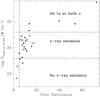 |
Fig. 4 Core dominance vs. Log PVLBA,8 GHz for LAT BL Lacs (filled squares) and non-LAT BL Lacs (crosses). |
Post correlation processing and imaging used the NRAO Astronomical Image Processing System (AIPS) package (Cotton 1993) and the Caltech Difmap packages (Pearson et al. 1994). The signal-to-noise ratio achieved allowed for phase self-calibration on a few sources. For detected sources observed in phase reference mode, we give the absolute core position (∗ in Col. 3 in Table 1). Otherwise the nuclear coordinates are taken from Very Large Array (VLA) data (see Table 1). We show in Fig. 2 contour clean maps for resolved sources in our VLBA data at least at one frequency. Contour levels are 3 × rms × (− 1, 1, 2, 4, 8, 16, 32, 64, 128, 256, ...), where rms is the noise level as measured from uniformly weighted images. We report the rms values for each target images in Table 2, together with the beam size and the flux density peak Speak. For undetected sources, not observed in phase reference mode, it was not possible to properly calibrate the visibility phases, and we are not able to give image parameters (see Table 2). As a reference, the upper flux density limits for non detections are the lowest flux density revealed without phase referencing in the whole sample, i.e. 15.3 mJy at 8 GHz (corresponding to J1221+0821) and 14.7 mJy at 15 GHz (corresponding to J1428+4240). For undetected sources observed in phase reference mode, upper limits are 3 × rms.
To derive an appropriate description of the parsec-scale structure of each source components, we applied Difmap model-fit to 8 and 15 GHz data of all detected sources using elliptical (e), circular (c) or delta components (δ) chosen on the base of the lower reduced Chi-squared values and the most reasonable parameters derived (e.g., major and minor axes, position) for each component. The Difmap model-fit program fits aggregates of various forms of model components, fitting directly to the real and imaginary parts of the observed visibilities using the powerful Levenberg-Marquardt nonlinear least-squares minimization technique. From the model-fits, we derived the total VLBA flux densities, which agree with those of the cleaned images. In Table 3, we report the parsec-scale morphology (point-like “p” or core-jet “1s”) and spectral indexes for detected BL Lacs, while in Table 4 we summarize the model-fit results for detected BL Lacs. All the calibrated uv and fits files are available at http://www.ira.inaf.it/progetti/bllacs/ and at the CDS.
4. Results
4.1. Detection rate
In our sample, 27/42 (64%) objects show parsec-scale radio emission. In particular, 24 BL Lac objects are revealed at both frequencies, while two are detected only at 8 GHz (J1221+0821 and J1231+6414) and one only at 15 GHz (J1427+5409).
We note that many of the sources revealed using phase referencing show a flux density below the noise level of sources observed without this technique. This suggests that more sources could be detected using the phase reference mode for all the observations (e.g., J1427+5409).
Point-like morphologies are present in 8/27 (31%) of the detected sources at 8 GHz, and in 14/26 (54%) of the revealed targets at 15 GHz (Table 3). The other detected sources show a one-sided structure. We note that in our sample, among the 8 BL Lacs having one-sided morphology at both frequencies, seven are the most luminous (and bright) BL Lacs on mas scale.
4.2. The spectral index
For each object detected at both VLBA frequencies, we estimated spectral indexes for the core component (αcore) and for the whole source (αtot). Values are reported in Table 3. For our spectral index analysis, we took flux density measurements (Table 4) as obtained by applying the model-fit to the data set with the entire (u, v) coverage. For some sources with complex parsec-scale structure (e.g. J1217+3007), we produced images at 8 GHz and 15 GHz using the same maximum and minimum baseline in the (u, v) coverage. This allows a better characterization of the core emission, especially when it is resolved well at the high frequency. We applied the model-fit to these (u, v) data and used the flux densities extracted from these visibilities for estimating the spectral indexes. The fraction of flat spectral indexes (αtot ≤ 0.6) is predominant (20/25) as expected for BL Lac objects.
We also attempted the study of the spectral index distribution along the source structure. However, in our observations, the (u, v) coverage is so different between 8 GHz and 15 GHz that a lot of data on the jet emission is lost by producing the U and X band images with the same (u, v) coverage. It turns out that no additional information could be derived from this analysis.
4.3. The source radio structures
A brief description of each source is reported in the Appendix. We discuss here the general properties of the sample. We evaluated, for all objects, the source compactness (SC) value defined as the ratio of the 8 GHz VLBA and the NVSS total powers. SC values are reported in Table 5, while in Fig. 3, we plot the SC distribution for our sample. We show SC values for both detected and non-detected sources, assuming for the latter upper flux density limits as explained in Sect. 3. Most of our sources show a parsec-scale flux density that is significantly lower than expected from the kiloparsec-scale flux densities estimated from the NVSS and/or FIRST radio surveys. In most cases, this difference cannot be due to the radio spectrum or to variability, and it suggests the presence of a subkiloparsec radio structure lost in VLBA data because of the lack of short baselines.
Moreover, we estimated the core dominance (CD) of each BL Lac of the sample as defined in Liuzzo et al. (2009). The CD is the ratio between the observed core radio power and the expected core radio power estimated from the unbeamed total radio power at low frequency, according to the relation given in Giovannini et al. (1994). The CD is a strong indication of the Doppler factor for each source and it allows for us to estimate constraints for the jet velocity and orientation. Since in most of our sample a measure of the total radio power at low frequency is unavailable, we estimated the total radio power at 408 MHz extrapolating the NVSS total radio power using an average spectral index =0.7. For the core radio power, we used the radio power at 8 GHz. In Fig. 3, we show the CD distribution for our sample. We added also the CD of radio sources (radio galaxies and 2 BL Lacs) from the Bologna Complete Sample (BCS, see Liuzzo et al. 2009) for a comparison. As expected, the distribution of BL Lac sources peaks at higher core dominance according to unified models.
In Fig. 4, we investigated the relation between the CD parameter with the total VLBA powers. As expected, bright BL Lacs have high core dominance, and a dependence with their high energy emission is present. We discuss this relation in Sect. 5.
Looking at the derived values of source compactness and core dominance, together with the source morphology and radio spectrum, the BL Lac objects of our sample could be divided as follows:
-
Doppler dominated (DD) sources: Among the 42BL Lacs, we have 23 sources in which the emissionis dominated by the central core. They are characterized by a CDalways larger than 5.5 suggesting that they are relativisticDoppler boosted objects. We note that a CD larger than 5.5 impliesa jet velocity ~0.8c or faster and a jet orientation with respect to the line of sight smaller than 30°. Most of these sources display a core dominant structure and a one-sided jet, confirming the importance of relativistic effects. The SC is generally high, even if in some case the missing flux density is important, suggesting the presence of a structure more complex than the detected one-sided jet. For comparison, we note that radio galaxies of the BCS (Liuzzo et al. 2009) show in most cases a CD smaller than four and in many cases smaller than one (Fig. 3).
-
Lobe dominated (LD) sources: In 11 cases, the VLBI total flux densities are a small fraction of the kiloparsec-scale ones, with CD < 5.5. This group includes both undetected and detected sources in our VLBA maps. In a few sources, the radio spectrum is quite steep, suggesting that they are dominated by an extended steep spectrum structure despite their classification as BL Lac objects.
-
Undetermined (U) objects: There are eight sources that are not detected in our VLBA images. Their arcsec flux density is low, therefore we cannot establish whether the lack of the detection is due to the absence of a compact core or to a sensitivity problem. Deeper observations will be needed to investigate their parsec-scale properties.
5. Gamma-ray properties
We searched for gamma-ray counterparts of our BL Lac sample: 14/42 show high energy emission in the Second LAT AGN catalog (2LAC, Ackermann et al. 2011a,b). We call them LAT BL Lacs. We collected gamma-ray flux measurements, together with all their available multifrequency information in Table 6. Among these LAT BL Lacs, two (J0847+1133 and J1534+3715) are classified as LD objects, the others as DD objects (Table 5). Moreover, the LD BL Lac J1534+3715 is the only LAT sources not detected by our VLBA observations: we have not considered it in our radio/gamma-ray correlation’s estimates (Figs. 4−6). Comparing their parsec scale properties, LAT BL Lacs are the most luminous on mas scale respect to the non-LAT objects. In particular, all LAT BL Lacs with Log PVLBA,8 GHz(W Hz-1) ≥ 24.6 present resolved morphologies both at 8 and 15 GHz. On the other hand, objects with Log PVLBA,8 GHz ≤ 23.6 do not show γ-ray emission, as sources with core dominance lower than 5.1 (Fig. 4). LAT BL Lac objects have also higher on average values of the source compactness and CD with respect to the non-LAT ones (Fig. 3). The correlation between CD parameter and total VLBA power (Fig.4) is much stronger (Pearson index correlation r = 0.84) for LAT objects than for non-LAT sources (r = 0.56). All these characteristics confirm the idea that LAT BL Lacs are dominated by Doppler boosting effects (note that the two BL Lacs of the BCS sample: Mrk 421 and Mrk 501, are LAT sources and they agree with the properties of LAT BL Lacs in our sample).
In Fig. 5, we plot the total 8 GHz-VLBA radio flux density (SVLBA,8 GHz) versus the gamma-ray fluxes: sources show a good correlation with the exception of J1419+5423, which has a very high total radio flux density (SVLBA,8 GHz ~ 969.5 mJy), but a modest gamma-ray flux (Sγ ~ 7.66 × 10⁻¹⁰ ph cm-2 s-1). This source also has SC = 1.19, and very high CD, with the VLBA total flux density greater than the kiloparsec-scale total flux density. Moreover, it is an extremely variable source (see Appendix) observed during an outburst, seen in both the Owens Valley Radio Observatory (OVRO, Richards et al. 2011) and MOJAVE monitoring programs. The likely reason for this source being an outlier on the SVLBA,8 GHz - gamma-ray flux plot is its steep spectral index value in the high-energy band implying that quite some gamma-ray flux is missed if a high lower cutoff (1 GeV) is selected. Thus, the photon flux at energy range [0.1–100] GeV is at the level of 10-8 ph cm-2 s-1, available from the history flux extension of the 2FGL (Ackermann et al. 2011a,b).
Multiwavelength properties of the sample.
We estimated the Pearson index correlation r for Log SVLBA,8 GHz and Log Sγ relation: we found r = 0.90, which means that a linear correlation is present between these quantities. We performed a linear fit (Log Sγ = a Log SVLBA,8 GHz + b) finding a = 0.69 and b = −9.97 (see dashed line in Fig. 5). The correlation is in agreement with results of Abdo et al. (2010) for BL Lac objects.
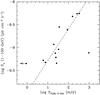 |
Fig. 5 Log SVLBA,8 GHz vs. Log Sγ for the 14 LAT BL Lacs in our sample. The arrow indicates the VLBA 8 GHz flux density upper limit for J1534+3715 which is not detected in our data (see Sect. 5). |
Figure 6 reports eight GHz-VLBA radio total flux densities SVLBA,8 GHz vs. photon indices (Γ). The Pearson index for the correlation involving sources detected in radio and gamma-ray bands is r = 0.90, and the linear fit (Log SVLBA,8 GHz = aΓ + b) gives a = 0.50 and b = 1.06. This result is expected as a consequence of the presence of the 8 GHz-VLBA radio/gamma-ray flux correlation (Abdo et al. 2010).
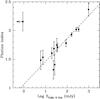 |
Fig. 6 Log SVLBA,8 GHz vs. photon index for the 14 LAT BL Lacs in our sample. The arrow indicates the VLBA 8 GHz flux density upper limit for J1534+3715 which is non detected in our data (see Sect. 5). |
6. Discussion and conclusion
We selected a sample of nearby BL Lacs with no constraint on their radio or high-energy emission to investigate their nuclear properties given that one of the surprising results of Fermi mission is that BL Lac objects, not FSRQs, are the most common gamma-ray emitters in the sky. In this first paper, we present 8 and 15 GHz VLBA images for the entire sample. They are also available at http://www.ira.inaf.it/progetti/bllacs/
From VLBI observations, we found that most of the BL Lacs in our sample (23/42) show a high core dominance (>5.5), in agreement with expectations from unified models. We classified these sources as DD objects. They show strong evidence of an active nuclear region affected by Doppler boosting effects, confirmed by the Fermi detection of 12 of these sources, and by the correlation between the radio flux density and gamma-ray flux. However, in many sources (14/23), the SC is lower than 0.5, suggesting that a significant sub-kiloparsec structure is present in many BL Lac sources.
Of the remaining sources, 11/42 were classified as LD sources. In these BL Lacs, the core dominance is lower than 5.5 and there is no evidence of a relativistic nuclear structure or strong boosting effects. This fraction is higher than expected in a sample of BL Lac sources. Among these objects, two have been detected by Fermi: J0847+1133 and J1534+3715. In the case of J0847+1133, we have a VLBI detection, and the core dominance is 5.1, therefore we can consider it as a source with intermediate properties. J1534+3715 was not detected in our VLBA observations and we suggest that it could be a misaligned object. Its core dominance is lower than 0.8. We note that, among the radio galaxies of the BCS sample (Liuzzo et al. 2009), only M 87 shows gamma-ray emission, and its core dominance is 0.9. We were unable to classify the eight other objects in our sample because of their low flux densities.
From a comparison of the CD distribution obtained for our BL Lac sample and for the radio galaxies of the BCS sample (Liuzzo et al. 2009), we can suggest there are two populations: beamed (core dominance ~5.5 or higher) and unbeamed objects (core dominance lower than ~5.5). We suggest that BL Lacs classified as LD objects could be intermediate or misclassified sources, but more multiwavelength information are needed to investigate this point. The origin of gamma-ray emission in sources in the two classes could be different: strongly related to the relativistic jets in DD, but not in LD. More data are necessary to investigate this scenario, and the radio structure of J1534+3715 needs to be confirmed.
In some DD sources (6/23) and all LD objects, the SC is lower than 0.3, suggesting the presence of a relevant subkiloparsec structure. The morphology and the properties of this extended radio emitting region will be analyzed with future observations that could help in understanding the difference between DD and LD BL Lacs and the connection with the high energy emission.
The BZ Cat is a catalog of blazars based on multifrequency surveys and on an extensive review of the literature. The adopted acceptance criteria are: 1. detection in the radio band, down to mJy flux densities at 1.4 GHz (NVSS, Condon et al. 1998; or FIRST, White et al. 1997) or 0.84 GHz (Sydney University Molonglo Sky Survey, SUMSS, Mauch et al. 2003); 2. optical identification and knowledge of the optical spectrum to establish the type of blazar; 3.isotropic X-ray luminosity close to or higher than 1043 erg s-1; 4. for FSRQs a spectral index, measured between 1.4 GHz (or 0.843 GHz) and 5 GHz, α < 0.5, but not for BL Lacs even though most of them have flat spectra; 5. compact radio morphology, or when extended, with one dominant core and a one-sided jet. For more details on the Roma BZ Cat see Massaro et al. (2009).
The completeness of BZ Cat for BL Lacs with z < 0.2 is, however, still an open question, since the completeness of the whole BZ Cat (Massaro et al. 2009). There is, in fact a deficiency of blazars in the southern sky due to the smaller number of surveys in comparison to the northern hemisphere, even if many new discovered blazars and candidates have been identified using spectroscopic observations available in the SDSS.
Acknowledgments
This work was supported by contributions of European Union, Valle D′Aosta Region, and the Italian Minister for Work and Welfare. We acknowledge the financial contribution from grant PRIN-INAF-2011. The authors wish to thank Prof. Enrico Massaro for his contribution in the early stages of this project. This research made use of the NASA/IPAC Extragalactic Data Base (NED), which is operated by the JPL, California Institute of Technology, under contract with the National Aeronautics and Space Administration. G.B.T. thanks NASA for support under FERMI grant NNX12AO75G.
References
- Abazajian, K. N., Adelman-McCarthy, J. K., Agüeros, M. A., et al. 2009, ApJS, 182, 543 [NASA ADS] [CrossRef] [Google Scholar]
- Ackermann, M., Ajello, M., Allafort, A., et al. 2011a, ApJ, 741, 30 [NASA ADS] [CrossRef] [Google Scholar]
- Ackermann, M., Ajello, M., Allafort, A., et al. 2011b, ApJ, 743, 171 [NASA ADS] [CrossRef] [Google Scholar]
- Abdo, A. A., Ackermann, M., Ajello, M., et al. 2010, ApJ, 715, 429 [NASA ADS] [CrossRef] [Google Scholar]
- Atwood, W. B., Abdo, A. A., Ackermann, M., et al. 2009, ApJ, 697, 1071 [NASA ADS] [CrossRef] [Google Scholar]
- Bondi, M., Marchã, M. J. M., Polatidis, A., et al. 2004, MNRAS, 352, 112 [NASA ADS] [CrossRef] [Google Scholar]
- Bourda, G., Charlot, P., Porcas, R. W., & Garrington, S. T. 2010, A&A, 520, A113 [NASA ADS] [CrossRef] [EDP Sciences] [Google Scholar]
- Cassaro, P., Stanghellini, C., Dallacasa, D., Bondi, M., & Zappalà, R. A. 2002, A&A, 381, 378 [NASA ADS] [CrossRef] [EDP Sciences] [Google Scholar]
- Cotton, W. D. 1993, AJ, 106, 1241 [NASA ADS] [CrossRef] [Google Scholar]
- Condon, J. J., Cotton, W. D., Greisen, E. W., et al. 1998, AJ, 115, 1693 [NASA ADS] [CrossRef] [Google Scholar]
- Fan, J. H., & Lin, R. G. 1999, ApJS, 121, 131 [NASA ADS] [CrossRef] [Google Scholar]
- Gabuzda, D. C., Mullan, C. M., Cawthorne, T. V., Wardle, J. F. C., & Roberts, D. H. 1994, ApJ, 435, 140 [NASA ADS] [CrossRef] [Google Scholar]
- Gabuzda, D. C., Sitko, M. L., & Smith, P. S. 1996, AJ, 112, 1877 [NASA ADS] [CrossRef] [Google Scholar]
- Gabuzda, D. C., Pushkarev, A. B., & Cawthorne, T. V. 1999, MNRAS, 307, 725 [NASA ADS] [CrossRef] [Google Scholar]
- Giovannini, G., Feretti, L., Venturi, T., et al. 1994, ApJ, 435, 116 [NASA ADS] [CrossRef] [Google Scholar]
- Giroletti, M., Giovannini, G., Feretti, L., et al. 2004a, ApJ, 600, 127 [NASA ADS] [CrossRef] [Google Scholar]
- Giroletti, M., Giovannini, G., Taylor, G. B., & Falomo, R. 2004b, ApJ, 613, 752 [NASA ADS] [CrossRef] [Google Scholar]
- Giroletti, M., Giovannini, G., Taylor, G. B., & Falomo, R. 2006, ApJ, 646, 801 [NASA ADS] [CrossRef] [Google Scholar]
- Hartman, R. C., Bertsch, D. L., Bloom, S. D., et al. 1999, ApJS, 123, 79 [NASA ADS] [CrossRef] [Google Scholar]
- Helmboldt, J. F., Taylor, G. B., Tremblay, S., et al. 2007, ApJ, 658, 203 [NASA ADS] [CrossRef] [Google Scholar]
- Hovatta, T., Lister, M. L., Aller, M. F., et al. 2012, AJ, 144, 105 [NASA ADS] [CrossRef] [Google Scholar]
- Jannuzi, B. T., Smith, P. S., & Elston, R. 1994, ApJ, 428, 130 [NASA ADS] [CrossRef] [Google Scholar]
- Jorstad, S. G., Marscher, A. P., Mattox, J. R., et al. 2001, ApJS, 134, 181 [NASA ADS] [CrossRef] [Google Scholar]
- Kellermann, K. I., Vermeulen, R. C., Zensus, J. A., & Cohen, M. H. 1998, AJ, 115, 1295 [NASA ADS] [CrossRef] [Google Scholar]
- Kellermann, K. I., Lister, M. L., Homan, D. C., et al. 2004, ApJ, 609, 539 [NASA ADS] [CrossRef] [Google Scholar]
- Kollgaard, R. I., Wardle, J. F. C., Roberts, D. H., & Gabuzda, D. C. 1992, AJ, 104, 1687 [NASA ADS] [CrossRef] [Google Scholar]
- Kuehr, H., Witzel, A., Pauliny-Toth, I. I. K., & Nauber, U. 1981, A&AS, 45, 367 [NASA ADS] [Google Scholar]
- Laurent-Muehleisen, S. A., Kollgaard, R. I., Moellenbrock, G. A., & Feigelson, E. D. 1993, AJ, 106, 875 [NASA ADS] [CrossRef] [Google Scholar]
- Lico, R., Giroletti, M., Orienti, M., et al. 2012, A&A, 545, A117 [NASA ADS] [CrossRef] [EDP Sciences] [Google Scholar]
- Lister, M. L., Aller, H. D., Aller, M. F., et al. 2009a, AJ, 137, 3718 [NASA ADS] [CrossRef] [Google Scholar]
- Lister, M. L., Cohen, M. H., Homan, D. C., et al. 2009b, AJ, 138, 1874 [NASA ADS] [CrossRef] [Google Scholar]
- Liuzzo, E., Giovannini, G., Giroletti, M., & Taylor, G. B. 2009, A&A, 505, 509 [NASA ADS] [CrossRef] [EDP Sciences] [Google Scholar]
- Massaro, E., Mantovani, F., Fanti, R., et al. 2004, A&A, 423, 935 [NASA ADS] [CrossRef] [EDP Sciences] [Google Scholar]
- Massaro, E., Giommi, P., Leto, C., et al. 2009, A&A, 495, 691 [NASA ADS] [CrossRef] [EDP Sciences] [Google Scholar]
- Mauch, T., Murphy, T., Buttery, H. J., et al. 2003, MNRAS, 342, 1117 [NASA ADS] [CrossRef] [Google Scholar]
- Nesci, R. 2010, AJ, 139, 2425 [NASA ADS] [CrossRef] [Google Scholar]
- Piner, B. G., & Edwards, P. G. 2004, ApJ, 600, 115 [NASA ADS] [CrossRef] [Google Scholar]
- Piner, B. G., Pant, N., & Edwards, P. G. 2008, ApJ, 678, 64 [NASA ADS] [CrossRef] [Google Scholar]
- Piner, B. G., Pant, N., & Edwards, P. G. 2010, ApJ, 723, 1150 [NASA ADS] [CrossRef] [Google Scholar]
- Pearson, T. J., Shepherd, M. C., Taylor, G. B., & Myers, S. T. 1994, BAAS, 26, 1318 [NASA ADS] [Google Scholar]
- Perlman Eric, S., & Stocke, J. T. 1994, AJ, 108, 56 [NASA ADS] [CrossRef] [Google Scholar]
- Rector, T. A., Gabuzda, D. C., & Stocke, J. T. 2003, AJ, 125, 1060 [NASA ADS] [CrossRef] [Google Scholar]
- Richards, J. L., Max-Moerbeck, W., Pavlidou, V., et al. 2011, ApJS, 194, 29 [NASA ADS] [CrossRef] [Google Scholar]
- Ros, E. 2011, Proc. Fermi & Jansky: Our Evolving Understanding of AGN, St Michaels, MD, eConf C1111101 [Google Scholar]
- Veron, M. P., & Veron, P. 1975, A&A, 42, 1 [NASA ADS] [Google Scholar]
- Weistrop, D., Shaffer, D. B., Hintzen, P., & Romanishin, W., 1985, ApJ, 292, 614 [NASA ADS] [CrossRef] [Google Scholar]
- White, R. L., Becker, R. H., Helfand, D. J., & Gregg, M. D. 1997, ApJ, 475, 479 [NASA ADS] [CrossRef] [Google Scholar]
- Wu, Z., Jiang, D. R., Gu, M., & Liu, Y. 2007, A&A, 466, 63 [NASA ADS] [CrossRef] [EDP Sciences] [Google Scholar]
Appendix A: Notes on single sources
-
J0751+1730. This source is unresolved at kiloparsec-scale witha total flux density of ~10 mJy in NVSS maps. From the VLA data archive (AB878) in B configuration, at 8 GHz, we obtained a slightly resolved image (~1.4′′with HPBW = 0.7′′), which implies
 . It is undetected in our VLBA images but with an upper limit higher than NVSS flux density. For technical problems it was not observed in phase reference mode. For this reason we classify this source among the U sources, even if the steep spectrum from VLA data suggests the presence of a lobe dominated structure.
 -
J0751+2913. This BL Lac is unresolved in FIRST images with a flux density of ~9 mJy. Since not observed for technical reasons at 8 GHz, it is not detected at 15 GHz above 1.8 mJy beam-1. Because of the low flux density at 1.4 GHz, we put it among undetermined objects.
-
J0753+2921. This source is unresolved in FIRST images (flux density =4.5 mJy), and is not detected in archival VLA data (AE110) at 5 GHz (HPBW = 5′′) suggesting a steep spectral index and a resolved structure, in agreement with the non detection above 0.9 mJy beam-1 and 1.2 mJy beam-1 at 8 and 15 GHz, respectively. We classify it as an U object because of the low flux density.
-
J0754+3910. This source shows a faint one-sided structure in NVSS images, but it appears unresolved in FIRST. In our 8 GHz VLBA map, it shows a core-jet morphology with a total flux density of ~27.0 mJy. At 15 GHz, it appears point-like with a total flux density of 17.8 mJy. Bourda et al. (2010) found a VLBI flux density =31 mJy (2 GHz) and 26 mJy (8 GHz). No gamma-ray emission is found associated to this target. We classify this source as DD.
-
J0809+3455. In the FIRST image, this source (also known as B2 0806+35) reveals a two-sided large-scale emission and a nuclear component with a bright one-sided jet to the south. The NVSS image shows a northern extension (more than 4′′ in size), confirming the asymmetric brightness of the kiloparsec-scale source. In our VLBA image at 8 GHz, we detect a one-sided structure that agrees with the FIRST bright jet and the VLBA map at 5 GHz by Bondi et al. (2004). The VLBA total flux density is 62.3 mJy at 8 GHz and 52.5 mJy at 15 GHz. The core has a flat spectrum and the jet flux density is ~24 mJy at lower and 14.3 mJy at higher frequency. No gamma-ray emission is found associated to this target. We classify this BL Lac as DD.
-
J0809+5218. This BL Lac shows a point-like structure in NVSS (total flux density ~183.8 mJy) and in FIRST images, as well as the VLA in A configuration (Giroletti et al. 2004). Our VLBA maps display, at both frequencies, a collimated jet oriented at notheast, but moving after a few mas in northern direction, with a large PA change, moving to the same PA visible in 5 GHz VLBA images (Giroletti et al. 2004b; MOJAVE Survey, Lister et al. 2009a,b), and VLA images (Helmboldt et al. 2007). Total flux densities are 89.1 mJy at 8 GHz and ~85.7 mJy at 15 GHz. This BL Lac shows gamma-ray emission (see Table 6 ). We classify it as DD.
-
J0810+4911. In NVSS and FIRST images this source appears symmetrically extended in PA ~ 135 deg, with a flux density ~10 mJy. The source is undetected above ~0.6 mJy beam-1 at 8 GHz and 1.8 mJy beam-1 at 15 GHz. SC is ≤0.06. No counterpart in the 2LAC is found. We classify this BL Lac as LD.
-
J0847+1133. This source is unresolved on kiloparsec-scale with flux density ~33 mJy. In our VLBA images, observational problems led to it not being detected at both frequencies, with an upper limit of ~15.3 mJy beam-1 at 8 GHz and 3 mJy beam-1 at 15 GHz. Bourda et al. (2010) revealed a VLBI flux density of 6 mJy in X band. We used this measurement to discuss properties of this source. This source is a LAT BL Lac showing a faint gamma-ray emission (Table 6). We classify this BL Lac as LD.
-
J0850+3455. On kiloparsec scales, this source is unresolved with a total flux density of 34.5 mJy in NVSS images. In our VLBA data, it shows a resolved morphology at both frequencies with total flux density of 28.6 at 8 GHz and 27.1 mJy at 15 GHz, in agreement with measurements of Bourda et al. (2010). No gamma-ray emission is found associated to this object. We classify this BL Lac as DD.
-
J0903+4055. This source is unresolved on kiloparsec scales with a flux density of ~35.8 mJy in the NVSS image. In our VLBA data, it shows a point-like structure with a flux density of ~9.1 mJy at 8 GHz and 6.3 mJy at 15 GHz. No gamma-ray emission is associated to this object. We classify it as DD.
-
J0916+5238. On kiloparsec scales, this BL Lac shows a core-jet structure with total flux density ~140 mJy in NVSS data and some evidences of extended emission. In our 8 GHz VLBA maps, it has a one-sided morphology: the jet is elongated to the north with a flux density of ~5.4 mJy, while the central unresolved component shows a ~24.1 mJy flux density. At 15 GHz, only the core is revealed with a flux density of 16.8 mJy. No gamma-ray counterpart is found in the 2 LAC for this source. We classify it as DD.
-
J0930+4950. This source appears clearly point-like both at arcsecond scale with a NVSS total flux density of ~21.3 mJy and in VLBA images (7.6 mJy at 8 GHz). No gamma-ray emission is found associated to this target. We classify it as DD.
-
J1012+3932. On kiloparsec scales, this object is point-like with NVSS total flux density of ~20 mJy. In our VLBA images, it is not detected above ~0.9 mJy beam-1 at 8 GHz and 1.5 mJy beam-1 at 15 GHz. SC is ≤0.05. No gamma-ray counterpart is found in the 2LAC. We classify this target as LD.
-
J1022+5124. On a kiloparsec scale, this target shows a point-like structure with a low flux density in the NVSS image of ~5.6 mJy. On a parsec scale, it is not detected above ~0.6 mJy beam-1 at 8 GHz and 1.8 mJy beam-1 at 15 GHz. No gamma-ray emission is found associated to this BL Lac. We classify it as U.
-
J1053+4929. This BL Lac is unresolved on kiloparsec scales with a total flux density of ~65.5 mJy in NVSS data. In our VLBA maps, it is one-sided at 8 GHz and point-like at 15 GHz. Its αcore is ~− 0.23 and it has an SC of ~0.51. No counterpart in the 2LAC catalog is found. We classify this target as DD.
-
J1058+5628. This BL Lac object has been studied by Nesci et al. (2010) in the B band: it is a quasi-periodic BL Lac, with an approximate period of 2590 days. In the radio band, it shows a kiloparsec unresolved structure with a total flux density in NVSS image of ~230 mJy. On mas scale, this object has a one-sided morphology at both frequencies to the western direction with 8 GHz core flux density of ~86.7 mJy, αcore ~ 0.03, 8 GHz total flux density of ~158.6 mJy and αtot ~ 0.33. The jet direction agrees with what is found by the MOJAVE survey (Lister et al. 2009a,b). SC is ~0.70. This target has a counterpart in the 2LAC (Table 6). We classify it as DD.
-
J1120+4212. This source has a point-like morphology on an arcsecond scale with a NVSS total flux density of ~23.5 mJy. Our VLBA maps revealed a one-sided structure at both frequencies, with a total 8 GHz flux density of ~14.8 mJy and 8 GHz jet flux density of ~4.7 mJy. The αtot is ~0.54, while SC is ~0.83. Moreover, it is a LAT BL Lac (Table 6). We classify it as DD.
-
J1136+6737. This BL Lac has a kiloparsec-scale point-like structure, and is also point-like in our 8 GHz VLBA data with an SC ~ 0.55. At 15 GHz, it is resolved into a one-sided jet morphology with αcore ~ 0.29, αtot ~ 0.25, and northeast jet flux density of ~9.6 mJy. Gamma-ray emission is found associated with this object (Table 6). We classify it as DD.
-
J1145-0340. This object is a part of a galaxy cluster (Piranomonte et al. 2007). On arcsecond scales, it appears unresolved with a total flux density of ~18.7 mJy in NVSS data. In our VLBA images, the source is not detected above ~1.2 mJy beam-1 and ~0.9 mJy beam-1 at 8 and 15 GHz, respectively. SC is ≤0.06. No gamma-ray emission is found associated to this target in the 2LAC. We classify it as LD.
-
J1156+4238. On arcsecond scales, this object is unresolved with a total flux density of ~15.6 mJy in the NVSS image. In our VLBA data, it shows a point-like structure with a total flux density of ~2.6 mJy at 8 GHZ and αcore,tot ~ − 1.16. We measure SC for this BL Lac to be ~0.17. No gamma-ray emission is found associated to this source. We classify it as LD.
-
J1201-0007. On kiloparsec scales, this source is unresolved with a total flux density of 69.5 mJy in the NVSS image. The FIRST image shows that this source is resolved into a double structure in north-south direction with flux density peaks of 8.7 mJy northern peak) and 17.5 mJy (southern peak). In our VLBA data, it is undetected at both frequencies above 15.3 mJy beam-1 at 8 GHz and 14.7 mJy beam-1 at 15 GHz, in agreement with the resolved arcsecond structure. No gamma-ray emission is found associated with this target. We classify this BL Lac as LD.
-
J1201-0011. On kiloparsec scales, this source is unresolved with a flux density of 28 mJy in the NVSS image. In our VLBA data, it is undetected at both frequencies above ≥0.6 mJy beam-1 at 8 GHz and ≥3 mJy beam-1 at 15 GHz. We measure SC to be ≤0.22. No gamma-ray emission is found associated to this target. We classify this BL Lac as LD.
-
J1215+0732. On kiloparsec-scales, a diffuse halo is present both in NVSS and FIRST images where a total flux density of ~138.8 mJy and ~81.8 mJy is revealed in NVSS and FIRST respectively. On parsec-scales, this object shows at 8 GHz a jet extending to the east (in agreement with the observations of Giroletti et al. 2004b, Rector et al. 2003 at 5 GHz) with a total flux density of ~36.6 mJy. At 15 GHz, the source is point-like with αtot ~ 0.9. SC is measured to be ~0.26. No gamma-ray emission is found associated to this BL Lac. We classify it as DD.
-
J1217+3007. This object is especially variable in the optical and polarized in optical and radio bands (Kollgaard et al. 1992; Fan & Lin 1999; Giroletti et al. 2004). NVSS data reveal a point-like structure with a total flux density of ~588 mJy. At 8 GHz, the parsec-scale jet is formed by a more collimated component connected to the central core by a separated, diffuse component starting at a distance of about 7 mas from the core and extending for 10 mas south-east. This extended emission is also prominent in the 5 GHz VLBA image obtained by Bondi et al. (2004). At 15 GHz, the VLBA map shows mainly the first jet component (~48 mJy), even if an hint of the same diffuse structure can also be noted here at a distance of ~14 mas from the nucleus. The jet structure agrees with what is observed in the MOJAVE and VIPS Surveys (Lister et al. 2009a,b; Helmboldt et al. 2007) where the jet detection extends up to 40 mas from the core. The total flux density in our VLBA images is similar at the two frequencies (~262 mJy at 8 GHz and ~217 mJy at 15 GHz). However, the NVSS flux density, on the kiloparsec scale, is more than twice the 8 GHz parsec-scale flux density, suggesting a spectrum steeper than −0.4. This target is also a LAT BL Lac (Table 6). We classify it as DD.
-
J1221+0821. This source has a point-like kiloparsec structure with a total flux density of ~178 mJy from NVSS maps. In our 8 GHz VLBA image, it appears unresolved with a total flux density of ~17.3 mJy, while at 15 GHz it is not detected above 14.7 mJy beam-1. SC is ~0.1. It is a non-LAT BL Lac. We classify it as LD.
-
J1221+2813. This source is known to be an extremely variable object, in infrared especially (Fan & Lin 1999), lying in the center of an elliptical galaxy (Weistrop et al. 1985). It was initially identified as the variable star W Comae. Arcsecond scale radio images (Kollgaard et al. 1992; Perlam et al. 1994) indicate a faint extended emission south-west of the core, which is also revealed in the FIRST image. The total flux density is ~739 mJy in NVSS images. On parsec scales, our VLBA observations show a long south-west jet-like feature at both frequencies. At 8 GHz it shows a straight jet extended more than 20 mas, where a large bend in PA (to the South) is present. This fainter resolved jet is marginally visible here but confirmed in lower resolution images (e.g. Helmboldt et al. 2007) while at 15 GHz it stops at about 10 mas from the nucleus, which has a flux density ~178.0 mJy and a flat spectrum. The jet structure contains numerous blobs of emission, especially at 15 GHz where it has a flux density of ~37.9 mJy. The same was found by Kellermann et al. (1998) in their 15 GHz VLBA observations and in the MOJAVE Survey (Lister et al. 2009a,b). Proper motions have been studied by Gabuzda et al. (1994) and Jorstad et al. (2001) with multiepoch VLBI observations at 5 and 22 GHz respectively, which have shown significant, often nonradial proper motions. The SC for this target is ~0.47. It has a gamma-ray counterpart in the 2LAC (Table 6). We classify this BL Lac as DD.
-
J1221+3010. The source is compact on kiloparsec scales with a NVSS flux density of ~72 mJy. Previous VLBA observations of Giroletti et al. (2004b) revealed a 10 mas jet emerging at PA ~ 90 deg. The total VLBA correlated flux density is 57 mJy and dominates the total flux density of the source. Our VLBA maps at 8 GHz detect a one-sided structure aligned with the 5 GHz jet with αcore ~ 0.17 and jet flux density of 16.9 mJy. In our 15 GHz map, the source is unresolved, even if a 10 mJy jet is detected in the MOJAVE Survey (Lister et al. 2009a,b) in the same direction of the 8 GHz one. Its SC is ~0.5. This target is also a LAT BL Lac (Table 6). We classify it as DD.
-
J1231+6414. The kiloparsec-scale structure shows an almost unresolved core with a total flux density of 59.3 mJy in the NVSS (see also Perlman 1994). A faint emission from a halo-like feature is also observed. On parsec scales at 8 GHz this source shows a one-sided jet pointing north-west. A similar structure has been found by Giroletti et al. (2004b) at 5 GHz. The 8 GHz total flux density is ~37.6 mJy. At 15 GHz it is undetected. SC for this object is 0.63. No association in the 2 LAC is found (Table 6). We classify this BL Lac as DD.
-
J1253+0326. This BL Lac shows an unresolved morphology both in NVSS and FIRST images with a total flux density of ~107 and ~79.2 mJy, respectively. On parsec scales, at 8 GHz it appears one-sided with a core flux density of ~29.5 mJy and a jet flux density of ~7 mJy, while at 15 GHz it has a point-like structure with a total flux density of ~27.1 mJy. SC is ~0.34. No gamma-ray emission is found associated to this target. We classify it as DD.
-
J1257+2412. This extremely weak object is only marginally resolved with the VLA with a total flux density of ~13.1 mJy in NVSS data. It was barely detected by the VLBA (~3 mJy core) at 5 GHz (Giroletti et al. 2004b). In our VLBA images at 8 GHz and 15 GHz, no emission is revealed above ~0.9 mJy beam-1 at both frequencies. SC is ≤0.07. No counterpart is found in the 2 LAC. We classify this source as LD.
-
J1341+3959. This source is unresolved both in NVSS and FIRST maps with a total flux density of ~85.6 mJy and ~57.9 mJy, respectively. On parsec scales, it shows a point-like structure with a core flux density of ~6.3 mJy at 8 GHz and ~5.8 mJy at 15 GHz. SC is ~0.07. It does not have any counterpart in the 2 LAC. We classify this BL Lac as LD.
-
J1419+5423. This is the most powerful object in the sample, and it is also the best studied, being in the BL Lac 1 Jy sample (Kuehr et al. 1981). It is an extremely peculiar (see Sect. 5) and variable, both on long and short timescales (Massaro et al. 2004) and at all frequencies. Variability in the optical and radio bands has shown to be correlated (Massaro et al. 2004), as has polarization (Gabuzda et al. 1996). Multi-epoch studies have shown that the flux density variability affects are related to the core component, rather than the extended south-east jet: for example, an increase of a factor 3 was observed in the core flux density in the period 1999–2001 (Massaro et al. 2004). Its radio structure on kiloparsec scales is point-like with a total flux density of ~818 mJy in the NVSS. Our VLBA maps show that at 8 GHz the source has a ~25 mas jet with about 25% of the total flux density, which is ~970 mJy. At 15 GHz, the jet is much shorter, around 4 mas, and makes up 47% of the total flux density of ~820 mJy. The jet structure is aligned with the one observed by the MOJAVE Survey (Lister et al. 2009a,b). It has a counterpart in the 2LAC (Table 6). We classify this target as DD.
-
J1427+3908. On arcsecond scales, this source is unresolved with an NVSS total flux density of ~7 mJy. In our VLBA data, no radio emission is revealed above ~0.6 mJy beam-1 and 0.9 mJy beam-1 at 8 and 15 GHz respectively. SC is ≤0.09. No counterpart is found in the 2LAC. We classify this object as U.
-
J1427+5409. The source is unresolved on kiloparsec scales with a total flux density of ~44.8 mJy in NVSS data. In our 8 GHz VLBA image it is not detected above ~15.3 mJy while in the phase referencing 15 GHz VLBA data it shows a point-like structure with a flux density of ~5.9 mJy. No gamma-ray counterpart is found associated with this object. We classify it as LD.
-
J1428+4240. In the NVSS images the source is unresolved with a total flux density of ~57.5 mJy. From VLA observations with ~2′′ resolution, this BL Lac shows some evidence of a diffuse radio halo around the core and it has relatively weak radio and optical polarization for a BL Lacertae object (Laurent-Muehleisen et al. 1993; Jannuzi et al. 1994; Giroletti et al. 2004b). Previous VLBI images did not find polarized emission (Kollgaard et al. 1994). In our VLBA map at 8 GHz it appears unresolved with a total flux density of ~23.2 mJy, while at 15 GHz it shows a one-sided structure with a core flux density of ~16.7 mJy and jet flux density of ~7.5 mJy. Gamma-ray emission is also found associated to this object (Table 6). We classify it as DD.
-
J1436+5639. This BL Lac shows a point-like structure both on arcsecond and milliarcsecond scales. In the NVSS it has a total flux density of ~20.7 mJy, while in our 8 GHz VLBA data the unresolved central component has a flux density of 7.6 mJy and αtot ~ 0.83. It is a LAT BL Lac (see Table 6). We classify this object as DD.
-
J1442+1200. In the NVSS the source appears unresolved with a total flux density of ~68 mJy. VLA images obtained by Giovannini et al. (2004b) with subarcsecond resolution show a nuclear flat spectrum emission surrounded by a steep-spectrum halo structure ~8′′ in size at 8.4 GHz moderately elongated in the southwest direction. Previous VLBA images (Giroletti et al. 2004b) revealed only a faint (15 mJy) core, possibly extended to the west. In our 8 GHz VLBA maps, we confirm the jet extension to the west with a flux density of ~4.2 mJy, while the core has a flux density of ~22.4 mJy. At 15 GHz, this BL Lac is unresolved with a total flux density of ~21.8 mJy. It has a 2 LAC counterpart (Table 6). We classify this target as DD.
-
J1510+3335. This source has an unresolved kiloparsec-scale morphology with a total flux density of ~7.4 mJy in the NVSS. In our VLBA maps it is not detected above ~0.9 mJy at both frequency. SC is ≤0.12. No gamma-ray emission is found for this BL Lac. We classify it as U.
-
J1516+2918. On kiloparsec scales, this source has a jet elongated in the north-west direction. The total flux density is ~137 mJy in the NVSS map, and ~74 mJy in FIRST data. In our VLBA images, it is one-sided at 8 GHz with a northeast jet (flux density of ~2.2 mJy) and total flux density of ~30.6 mJy. At 15 GHz, it has a ~28.9 mJy point-like structure. It is not a LAT BL Lac. We classify it as DD.
-
J1534+3715. This source is unresolved on kiloparsec scales with a total flux density of ~21 mJy in NVSS images. On parsec-scales, no radio emission is revealed above ~0.9 mJy beam-1 at both frequencies. SC is ≤0.04. A gamma-ray counterpart is found in the 2LAC (see Table 6). We classify this BL lac as LD. The non detection by the VLBA could be due to an unsuccessful phase referencing observation. Deeper analysis and new VLBI observations will be necessary to investigate its nuclear properties, and to confirm the lack of a compact emission despite the high-frequency properties.
-
J1604+3345. This source is unresolved with a total flux density of ~7.1 mJy in NVSS data. In our VLBA maps, it is not detected above ~0.6 mJy beam-1 and 1.2 mJy beam-1 at 8 and 15 GHz, respectively. SC is ≤0.09. No gamma-ray counterpart is found associated to this BL Lac. We classify it as U.
-
J1647+2909. On arcsecond scales, this BL Lac shows some diffuse halo-like structure around the central core component. The total flux density in the NVSS image is ~395 mJy and 276 mJy in the FIRST image. In our VLBA images, it shows a one-sided morphology in the north direction (aligned with that revealed by the VIPS survey, Helmboldt et al. 2007) with a total 8 GHz flux density of 64.5 mJy, αcore ~ 0.45, and SC ~0.23. No gamma-ray counterpart is found associated to this target. We classify it as DD.
All Tables
All Figures
|
Fig. 1 Distribution of the NVSS flux density for the sources in our sample. The dashed lines show the flux density limits of the MOJAVE-1 (M) and VIPS surveys (V), extrapolated assuming α = 0.0. |
| In the text | |
|
Fig. 2 8.4 and 15 GHz VLBA images of resolved BL Lacs. |
| In the text | |
|
Fig. 2 continued. |
| In the text | |
|
Fig. 3 Source compactness (SC, top panel) and core dominance (CD, bottom panel) distributions for the present sample of BL Lacs using the classification given in Sect. 4.3. U.L. indicates that the corresponding values are upper limits. Gamma-ray BL Lacs are reported with black dots. In the CD histogram, we plot sources (all radio galaxies, but 2 BL Lacs) of the Bologna Complete Sample (Liuzzo et al. 2009). Two different symbols are used to represent the three gamma-ray BCS sources: M 87 (star) and 2 BL Lacs (square). Arrows indicate upper- and lower-limit CD values. |
| In the text | |
|
Fig. 4 Core dominance vs. Log PVLBA,8 GHz for LAT BL Lacs (filled squares) and non-LAT BL Lacs (crosses). |
| In the text | |
|
Fig. 5 Log SVLBA,8 GHz vs. Log Sγ for the 14 LAT BL Lacs in our sample. The arrow indicates the VLBA 8 GHz flux density upper limit for J1534+3715 which is not detected in our data (see Sect. 5). |
| In the text | |
|
Fig. 6 Log SVLBA,8 GHz vs. photon index for the 14 LAT BL Lacs in our sample. The arrow indicates the VLBA 8 GHz flux density upper limit for J1534+3715 which is non detected in our data (see Sect. 5). |
| In the text | |
Current usage metrics show cumulative count of Article Views (full-text article views including HTML views, PDF and ePub downloads, according to the available data) and Abstracts Views on Vision4Press platform.
Data correspond to usage on the plateform after 2015. The current usage metrics is available 48-96 hours after online publication and is updated daily on week days.
Initial download of the metrics may take a while.