Free Access
Fig. 5
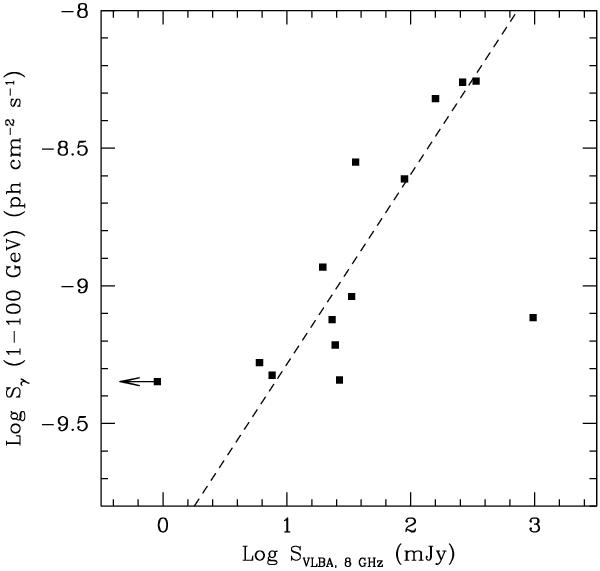
Log SVLBA,8 GHz vs. Log Sγ for the 14 LAT BL Lacs in our sample. The arrow indicates the VLBA 8 GHz flux density upper limit for J1534+3715 which is not detected in our data (see Sect. 5).
Current usage metrics show cumulative count of Article Views (full-text article views including HTML views, PDF and ePub downloads, according to the available data) and Abstracts Views on Vision4Press platform.
Data correspond to usage on the plateform after 2015. The current usage metrics is available 48-96 hours after online publication and is updated daily on week days.
Initial download of the metrics may take a while.