Fig. 9
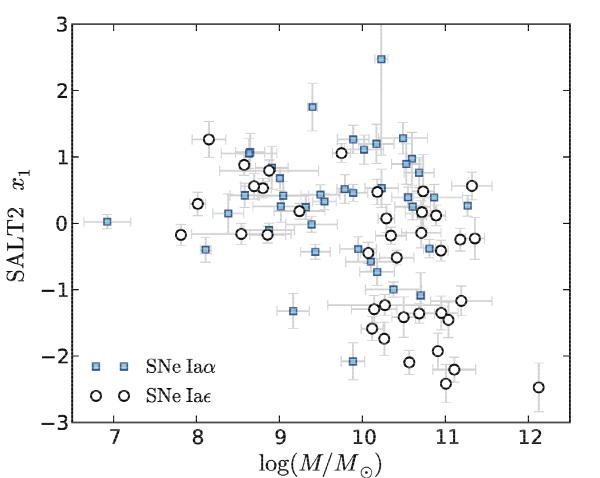
SN Ia x1 vs. total host stellar mass (Childress et al. 2013a). Markers follow the same color and shape code as in Fig. 6. Note the distinctive “L”-shaped distribution of the SNe Iaϵ.
Current usage metrics show cumulative count of Article Views (full-text article views including HTML views, PDF and ePub downloads, according to the available data) and Abstracts Views on Vision4Press platform.
Data correspond to usage on the plateform after 2015. The current usage metrics is available 48-96 hours after online publication and is updated daily on week days.
Initial download of the metrics may take a while.