Fig. 8
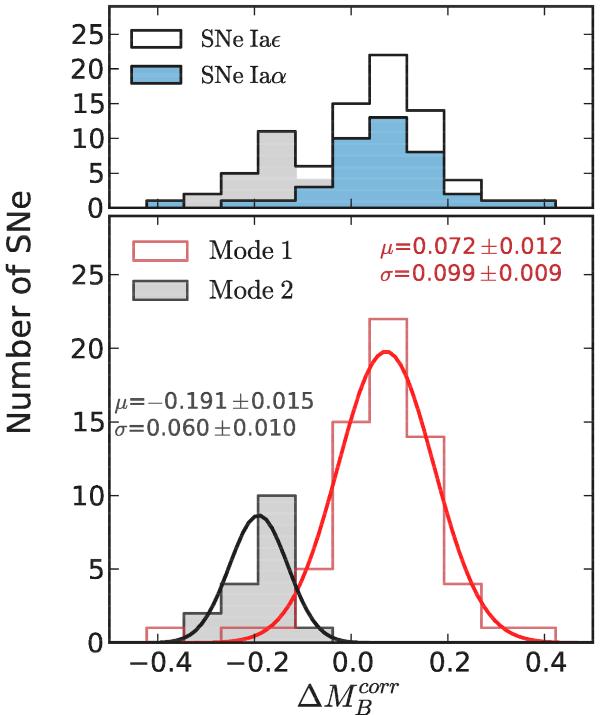
Distribution of corrected Hubble residuals per ΣHα
group (top, as in Fig. 6)
and per mode (bottom) for the full sample. In the lower panel,
the open-red and the filled-gray histograms represent the corrected Hubble
residual distributions of M1 and
M2, respectively. By definition of the modes, the
red histogram corresponds to the stack of the blue distribution with the open
histogram above  (see the top-panel),
while the filled-gray histogram corresponds to the part of the open histogram
below . Colored solid lines
(red for M1 and black for
M2) show the best fit by a normal distribution (with
3σ clipping). Fit parameters are quoted beside each Gaussian.
(see the top-panel),
while the filled-gray histogram corresponds to the part of the open histogram
below . Colored solid lines
(red for M1 and black for
M2) show the best fit by a normal distribution (with
3σ clipping). Fit parameters are quoted beside each Gaussian.
Current usage metrics show cumulative count of Article Views (full-text article views including HTML views, PDF and ePub downloads, according to the available data) and Abstracts Views on Vision4Press platform.
Data correspond to usage on the plateform after 2015. The current usage metrics is available 48-96 hours after online publication and is updated daily on week days.
Initial download of the metrics may take a while.