Fig. 7
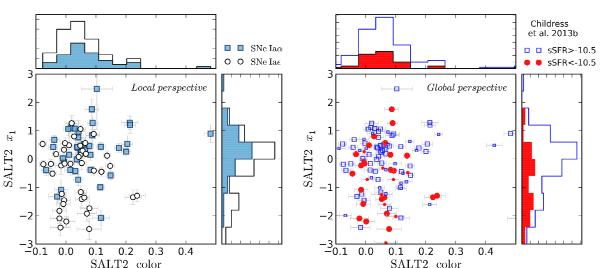
SALT2 stretch x1 vs. color c. Left: the local perspective. SNe markers and x1 and c marginalized stacked distributions follow the same color-shape code as Fig. 6. Right: the global perspective. Open-blue squares show the globally star-forming hosts and red dots show the globally passive hosts (log (sSFR) ≶ −10.5 respectively). Big markers indicate SNe with local measurements, while small markers denote SNe not in our local sample (failed redshift cut, but passed the quality cuts, see Sect. 2.1). Stacked histograms are the marginalized distributions of x1 and c using the marker color codes. These figures compare to Fig. 2 of Lampeitl et al. (2010). Notice the mix of local environments for moderate x1 while low x1 are almost exclusively from passive environments.
Current usage metrics show cumulative count of Article Views (full-text article views including HTML views, PDF and ePub downloads, according to the available data) and Abstracts Views on Vision4Press platform.
Data correspond to usage on the plateform after 2015. The current usage metrics is available 48-96 hours after online publication and is updated daily on week days.
Initial download of the metrics may take a while.