Fig. 6
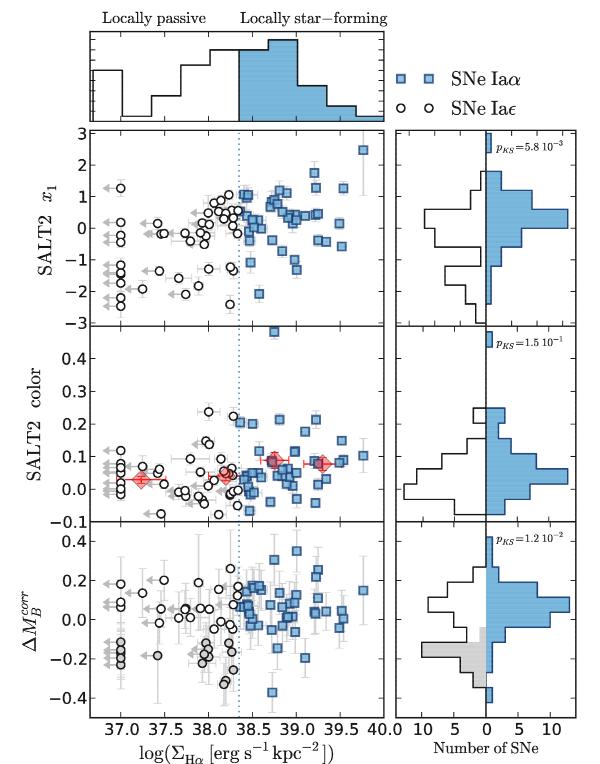
SN Ia parameters as a function of log (ΣHα), the surface
brightness in the 1 kpc radius around the SNe Ia. Upper panel: the
log (ΣHα) distribution colored with respect to
ΣHα subgroups: Iaϵ and
Iaα are shown as empty-black and filled-blue histograms,
respectively. Main panels, from top to bottom: SALT2 stretch
x1, color c, and the Hubble residuals
corrected for stretch and color  (with
a standardization done over the whole sample). Symbol shapes and colors are the same
as in Fig. 5. In the middle panel, filled-red
diamonds show the mean SALT2 color measured in bins of
log (ΣHα): x-axis error bars indicate
the log (ΣHα) dispersion of the SNe of the considered bin.
In the panel,
the M2 SNe (Iaϵ with
< −0.1,
see text) are shown as filled-gray circles. Right panels, from top to
bottom: marginal distributions of x1,
c, and by
subgroups. These bi-histograms follow the same color code as the
log (ΣHα) histogram. The contribution of the
M2 SNe to the
Iaϵ
distribution is shown in gray in the lower right panel.
(with
a standardization done over the whole sample). Symbol shapes and colors are the same
as in Fig. 5. In the middle panel, filled-red
diamonds show the mean SALT2 color measured in bins of
log (ΣHα): x-axis error bars indicate
the log (ΣHα) dispersion of the SNe of the considered bin.
In the panel,
the M2 SNe (Iaϵ with
< −0.1,
see text) are shown as filled-gray circles. Right panels, from top to
bottom: marginal distributions of x1,
c, and by
subgroups. These bi-histograms follow the same color code as the
log (ΣHα) histogram. The contribution of the
M2 SNe to the
Iaϵ
distribution is shown in gray in the lower right panel.
Current usage metrics show cumulative count of Article Views (full-text article views including HTML views, PDF and ePub downloads, according to the available data) and Abstracts Views on Vision4Press platform.
Data correspond to usage on the plateform after 2015. The current usage metrics is available 48-96 hours after online publication and is updated daily on week days.
Initial download of the metrics may take a while.