Fig. 5
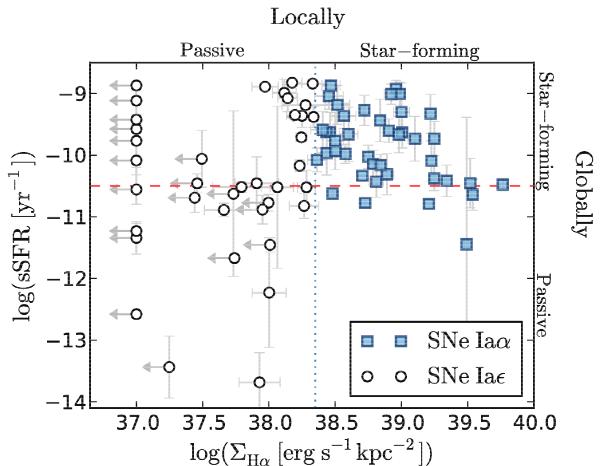
Local vs. global star-forming environment. Blue squares and open-circles show the SNe Ia from locally star-forming and passive regions, respectively (log (ΣHα) ≷ 38.35, blue-dotted line). Gray arrows indicate points with ΣHα signals compatible with zero (detection at less than 2σ). The red-dashed line indicates the limit that is commonly used to distinguish between star-forming and passive galaxies when using global host galaxy measurements (log (sSFR) ≷ −10.5). Three SNe Ia from our sample do not have sSFR measurements.
Current usage metrics show cumulative count of Article Views (full-text article views including HTML views, PDF and ePub downloads, according to the available data) and Abstracts Views on Vision4Press platform.
Data correspond to usage on the plateform after 2015. The current usage metrics is available 48-96 hours after online publication and is updated daily on week days.
Initial download of the metrics may take a while.