Fig. 4
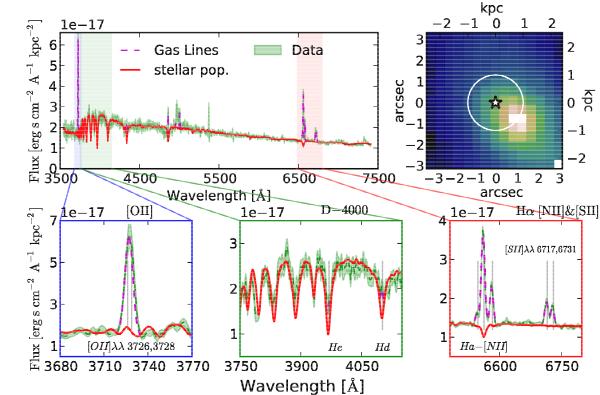
Spectral fit of the host mean spectrum in the projected 1 kpc radius around SNF20060512-001. Top right: reconstructed image of a final reference exposure. The circle aperture shows the 1 kpc aperture centered on the SN location (central star marker). Top left: mean host spectrum within 1 kpc radius around the SN (rest-frame, green dashed-line with ± 1σ error band), averaged over 21 cubes (including two final references). The best ULySS fit is shown as the sum of a stellar continuum (red line) and gas lines (magenta dashed line). Bottom, from left to right: zoom on [O ii]λλ3726,3728, 4000 Å break, and Hα + [N ii]λλ6548,6584 + [S ii]λλ6716,6731 wavelength regions.
Current usage metrics show cumulative count of Article Views (full-text article views including HTML views, PDF and ePub downloads, according to the available data) and Abstracts Views on Vision4Press platform.
Data correspond to usage on the plateform after 2015. The current usage metrics is available 48-96 hours after online publication and is updated daily on week days.
Initial download of the metrics may take a while.