Fig. 3
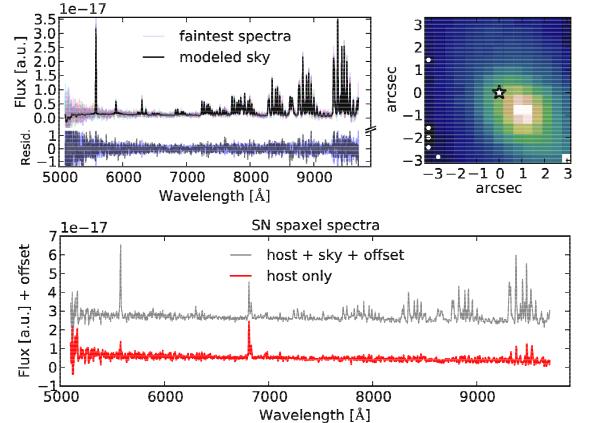
Sky subtraction process for an R cube of host-SNF20060512-001. Top right: reconstructed image of a final reference acquisition (it could as well be an SN-subtracted cube); the central star marker indicates the SN location. The dot markers indicate the faintest spaxels used to measure the presumed sky. Top left: modeled sky (thick black) fit over the mean of the five faintest spectra (thin colored); the bottom part shows the fit residuals, compared to the presumed sky error (blue band). Bottom: host spectrum at the SN location before (upper thin gray line) and after (lower thick red line) the sky subtraction. The emission at 6830 Å is the Hα+[N ii] gas line complex, left untouched by the sky subtraction procedure. The few small features further toward the red are residuals from the sky subtraction, but this part of the spectrum is not used in this analysis. See Sect. 2.3 for details.
Current usage metrics show cumulative count of Article Views (full-text article views including HTML views, PDF and ePub downloads, according to the available data) and Abstracts Views on Vision4Press platform.
Data correspond to usage on the plateform after 2015. The current usage metrics is available 48-96 hours after online publication and is updated daily on week days.
Initial download of the metrics may take a while.