Fig. 11
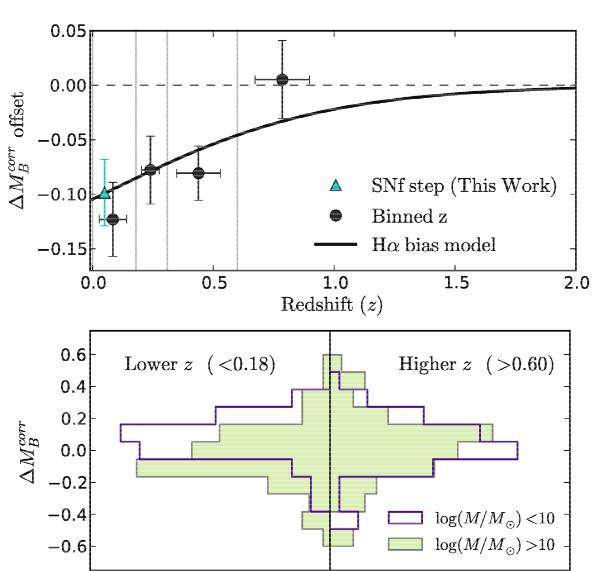
Observed and predicted redshift evolution of the
 offset between SNe from low- and high-mass hosts
(log (M/M⊙) ≶ 10),
i.e the “mass step”. Top: black markers show the observed mass
step offset per redshift bin (delimited by gray vertical lines). Error bars in
redshift represent the dispersion within each redshift bin. The black line is the
prediction from Eq. (5), whose
amplitude has been set to the SNfactory mass step amplitude at
z = 0.05 (filled-cyan triangle). Bottom:
distribution of the
of SNe Ia from low- (filled-yellow) and high-mass (open-purple) hosts. The left
histograms correspond to the closest SNe
(z < 0.18) while the right ones are for
the highest-z SNe
(z > 0.6). The difference within a
redshift bin of the mean value for low- and high-mass distributions defines the
mass step at this redshift, as plotted in the upper panel.
offset between SNe from low- and high-mass hosts
(log (M/M⊙) ≶ 10),
i.e the “mass step”. Top: black markers show the observed mass
step offset per redshift bin (delimited by gray vertical lines). Error bars in
redshift represent the dispersion within each redshift bin. The black line is the
prediction from Eq. (5), whose
amplitude has been set to the SNfactory mass step amplitude at
z = 0.05 (filled-cyan triangle). Bottom:
distribution of the
of SNe Ia from low- (filled-yellow) and high-mass (open-purple) hosts. The left
histograms correspond to the closest SNe
(z < 0.18) while the right ones are for
the highest-z SNe
(z > 0.6). The difference within a
redshift bin of the mean value for low- and high-mass distributions defines the
mass step at this redshift, as plotted in the upper panel.
Current usage metrics show cumulative count of Article Views (full-text article views including HTML views, PDF and ePub downloads, according to the available data) and Abstracts Views on Vision4Press platform.
Data correspond to usage on the plateform after 2015. The current usage metrics is available 48-96 hours after online publication and is updated daily on week days.
Initial download of the metrics may take a while.