Fig. 10
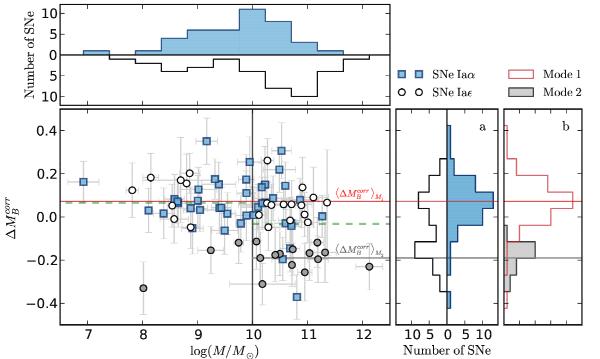
Corrected Hubble residuals as a function of the total host stellar mass, showing
the mass step. Markers follow the same color and shape code as in Fig. 6. Top: total host stellar mass
distribution per ΣHα subgroup. Right:
 distribution per ΣHα subgroup a) and per
mode b), as shown in Fig. 8.
Horizontal red and gray lines indicate M1 and
M2 weighted mean values, respectively.
Central panel: left and right green horizontal dashed lines
indicate the weighted mean
of SNe Ia hosted by galaxies more or less massive than
log (M/M⊙) = 10
(vertical gray line). The difference between those two magnitudes defines the
“mass step.”
distribution per ΣHα subgroup a) and per
mode b), as shown in Fig. 8.
Horizontal red and gray lines indicate M1 and
M2 weighted mean values, respectively.
Central panel: left and right green horizontal dashed lines
indicate the weighted mean
of SNe Ia hosted by galaxies more or less massive than
log (M/M⊙) = 10
(vertical gray line). The difference between those two magnitudes defines the
“mass step.”
Current usage metrics show cumulative count of Article Views (full-text article views including HTML views, PDF and ePub downloads, according to the available data) and Abstracts Views on Vision4Press platform.
Data correspond to usage on the plateform after 2015. The current usage metrics is available 48-96 hours after online publication and is updated daily on week days.
Initial download of the metrics may take a while.