Fig. 5
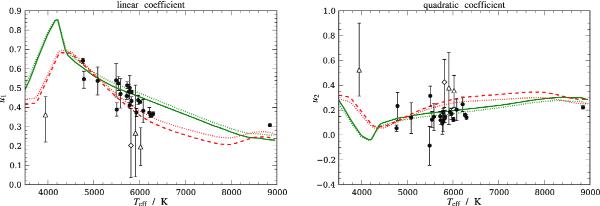
Quadratic LDCs determined by MCMC for our high signal-to-noise target sample (see Table 1). For comparison, the graphs show model predictions based on PHOENIX (solid) and ATLAS (dashed) atmospheric models, taken from Claret & Bloemen (2011). The dotted lines show Claret and Bloemen’s LDCs determined for the same atmospheres by different methods (see Sect. 5.1). The diamond symbol indicates TrES-2, which has the highest impact parameter of this sample (b = 0.845). Triangles mark conspicuous objects, discussed in Sect. 5.3.
Current usage metrics show cumulative count of Article Views (full-text article views including HTML views, PDF and ePub downloads, according to the available data) and Abstracts Views on Vision4Press platform.
Data correspond to usage on the plateform after 2015. The current usage metrics is available 48-96 hours after online publication and is updated daily on week days.
Initial download of the metrics may take a while.