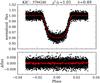
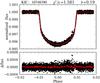
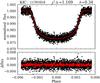
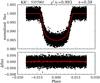
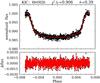
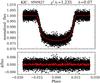
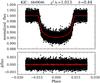
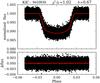
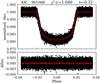
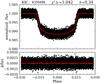
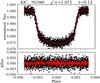
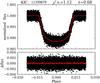
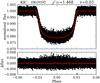
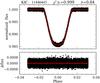
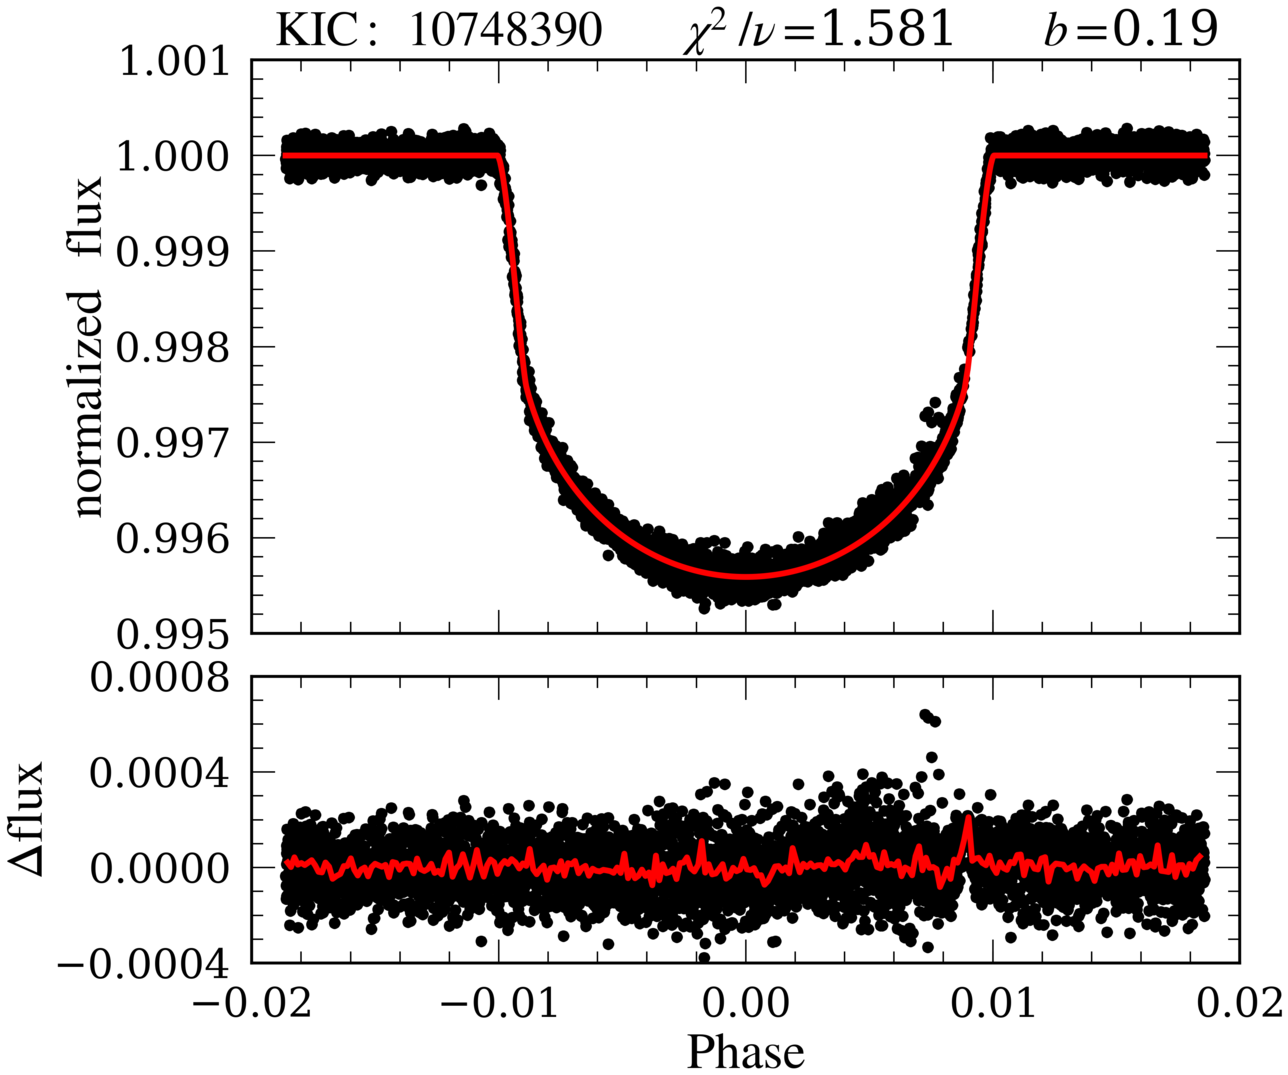
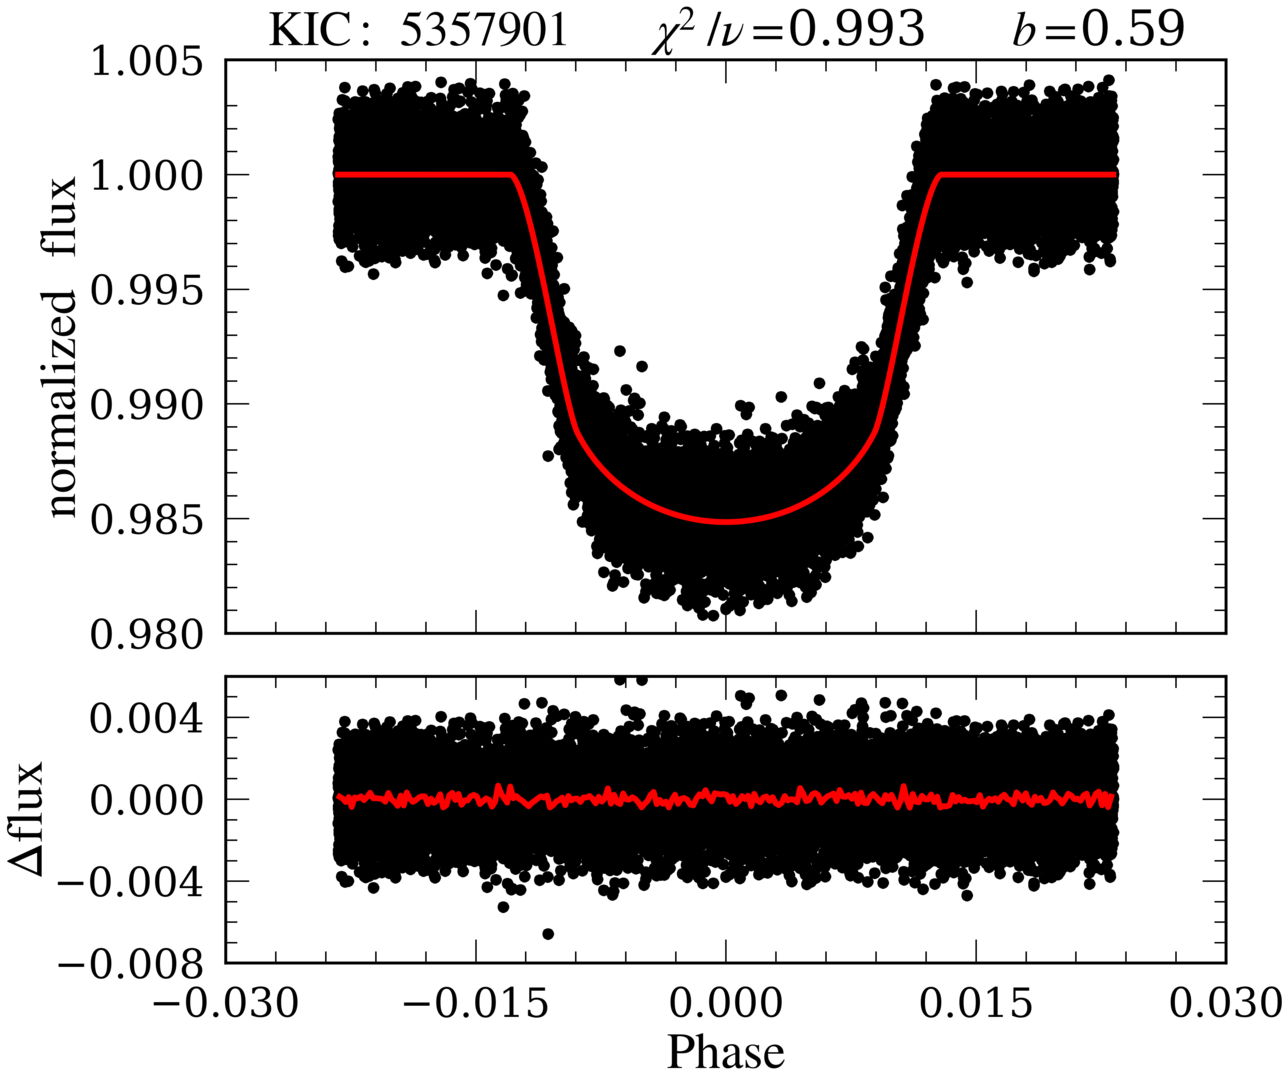
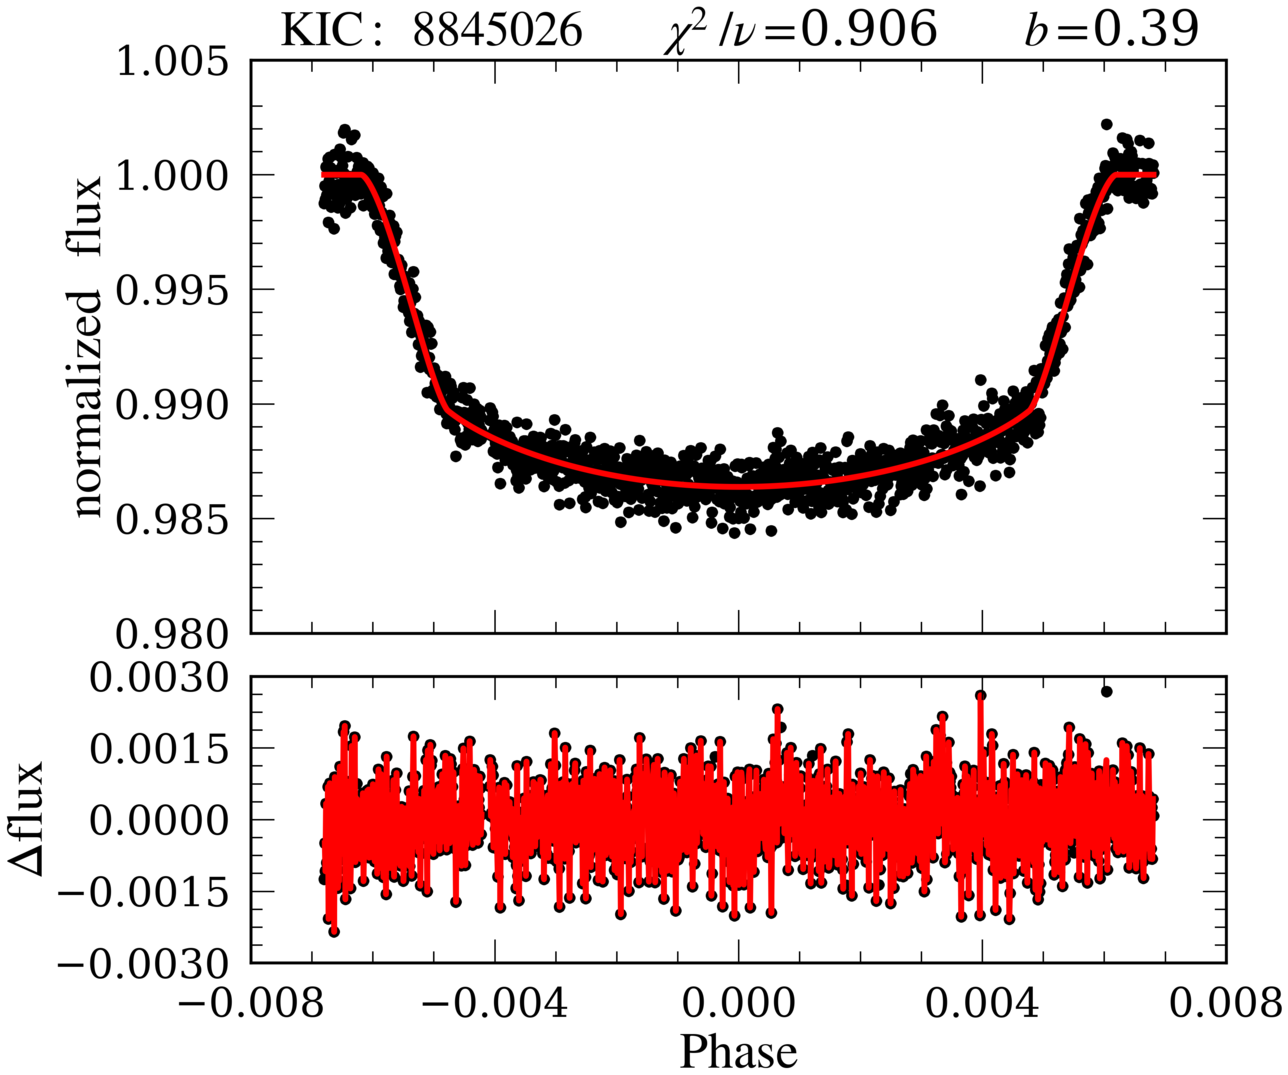
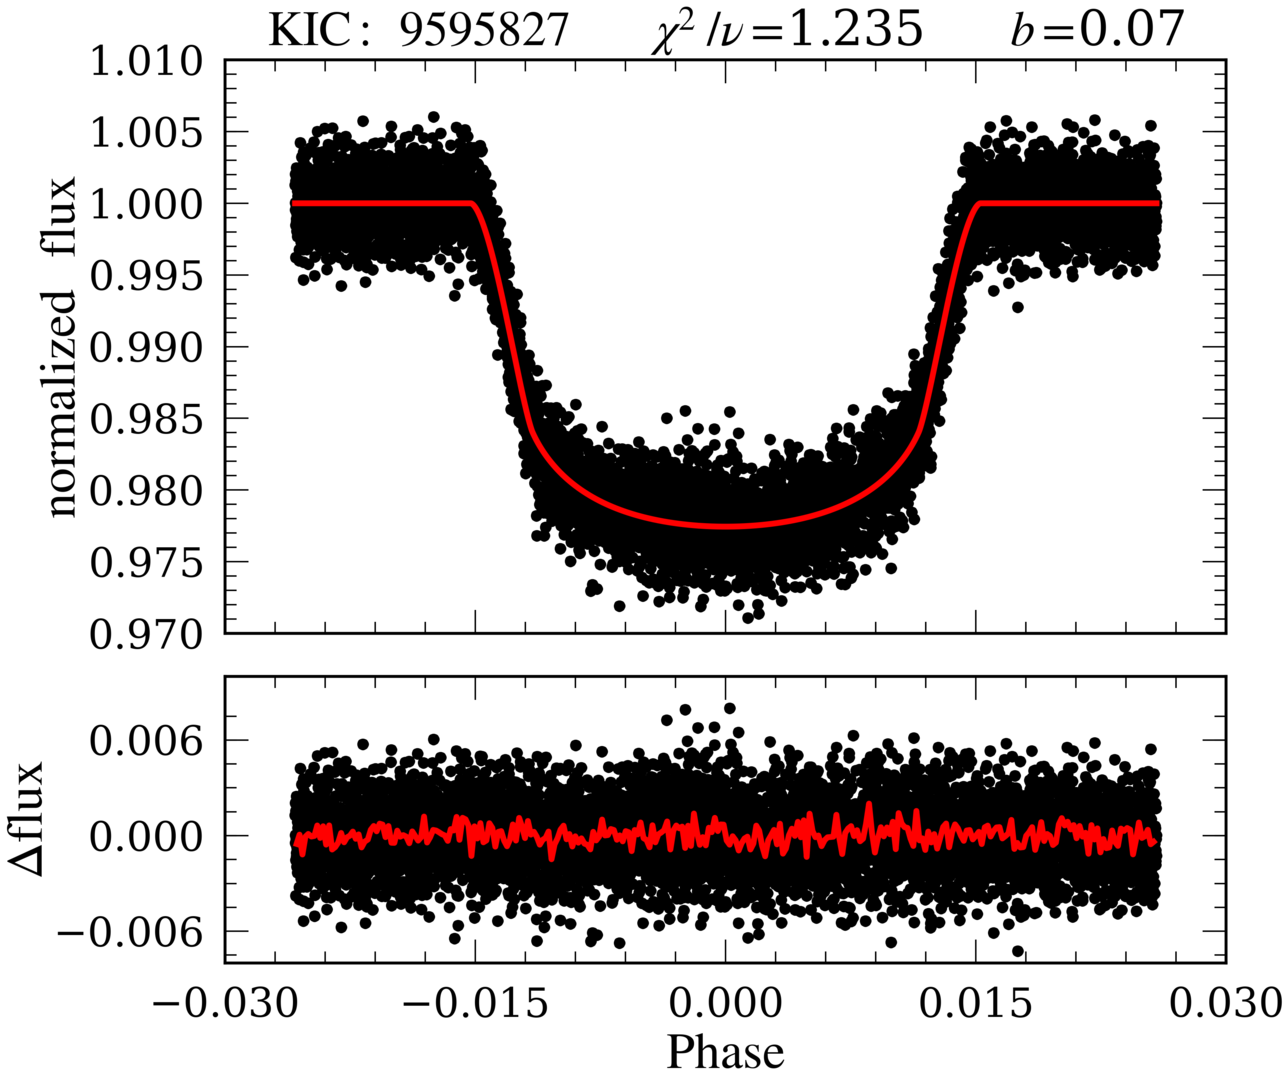
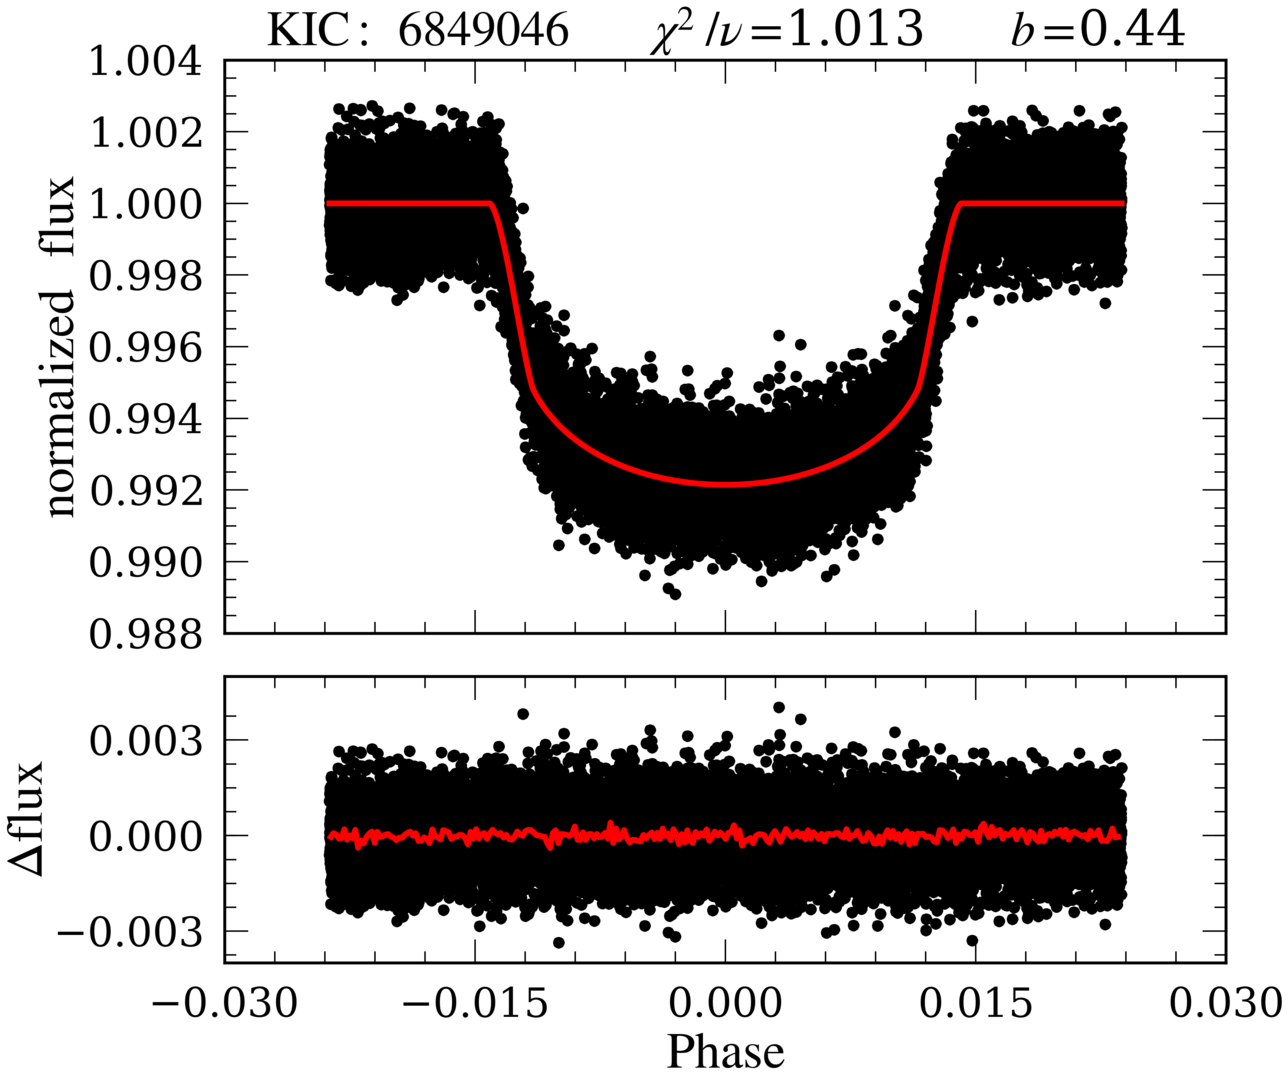
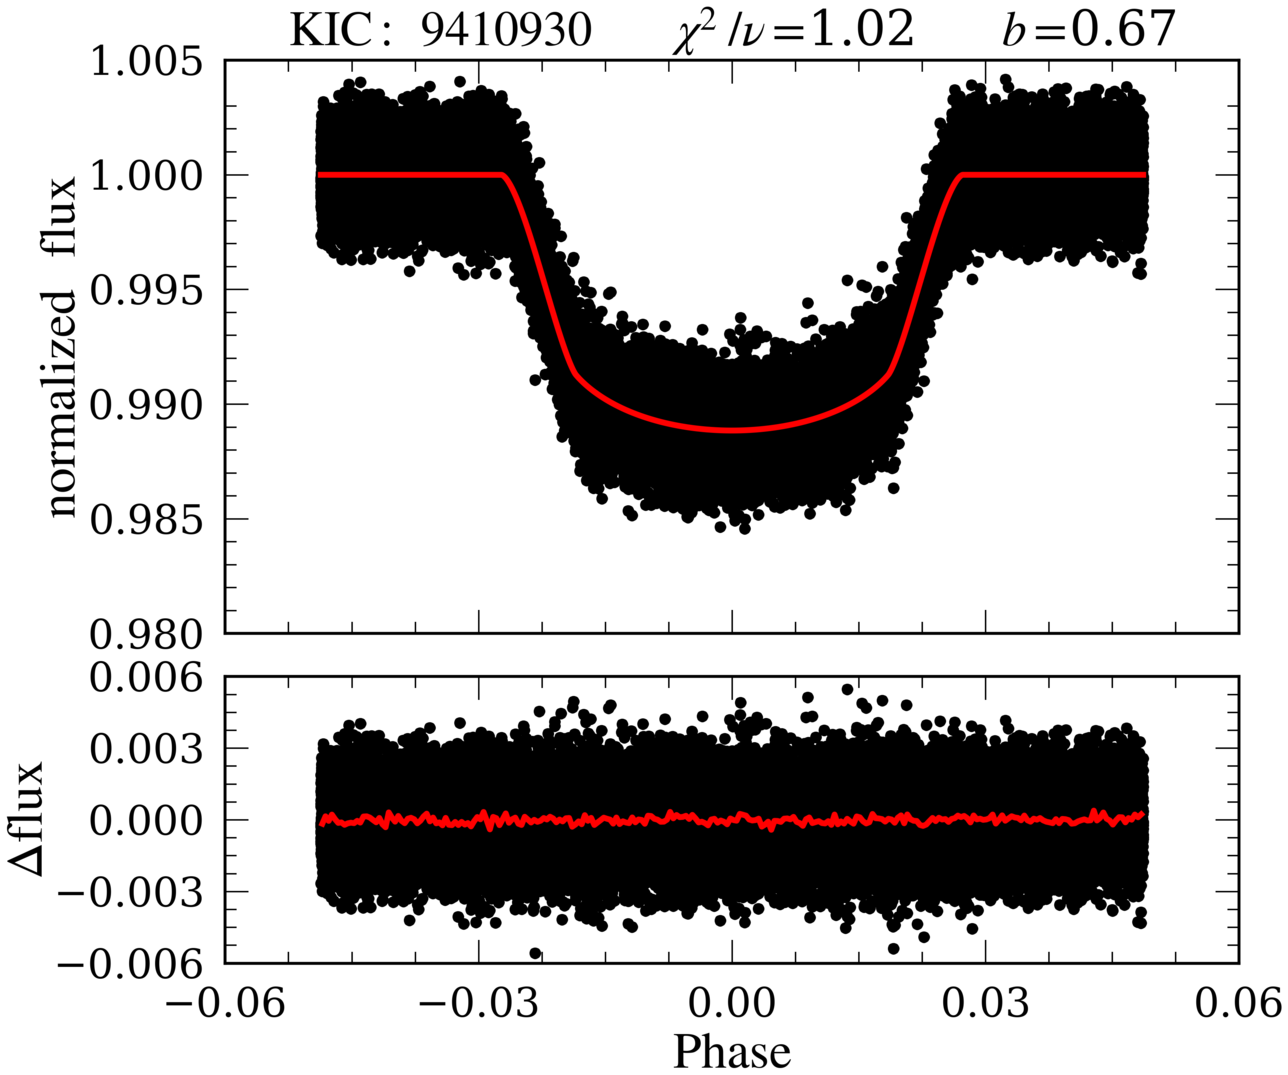
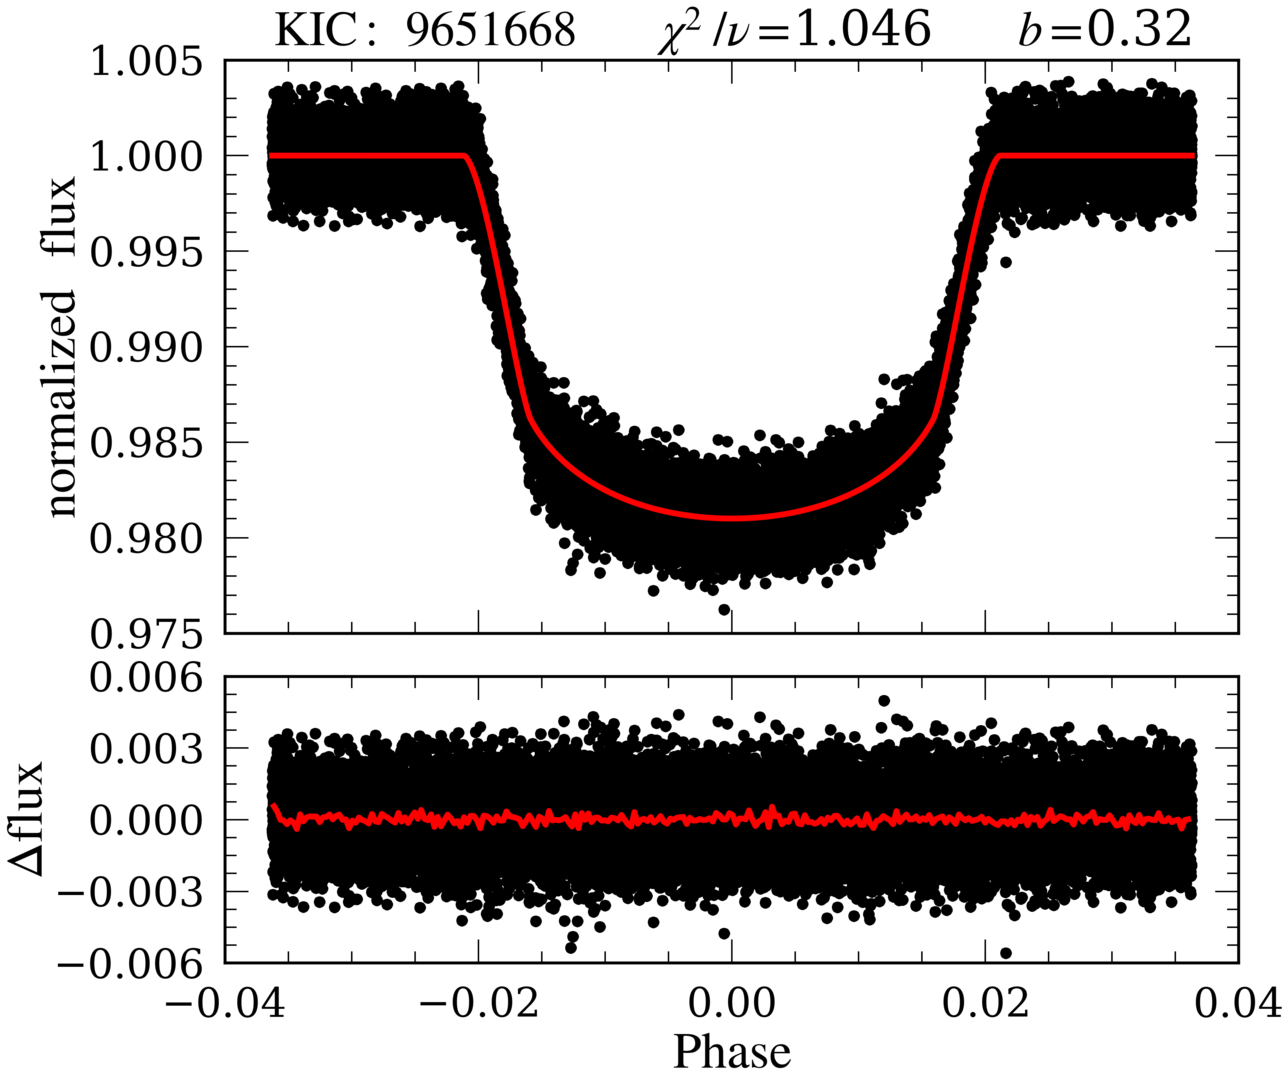
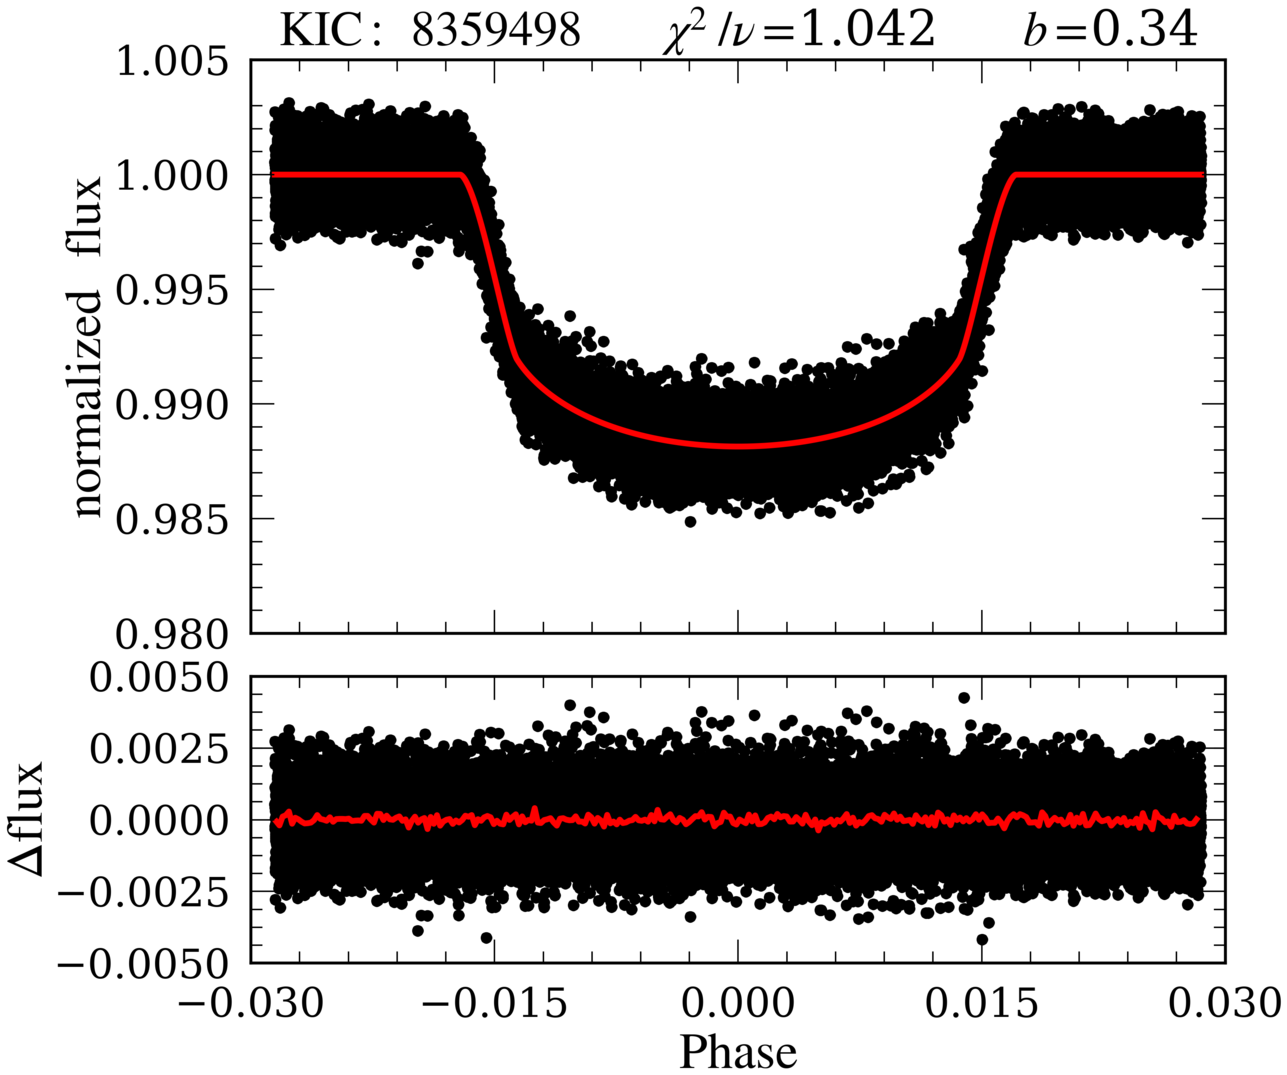
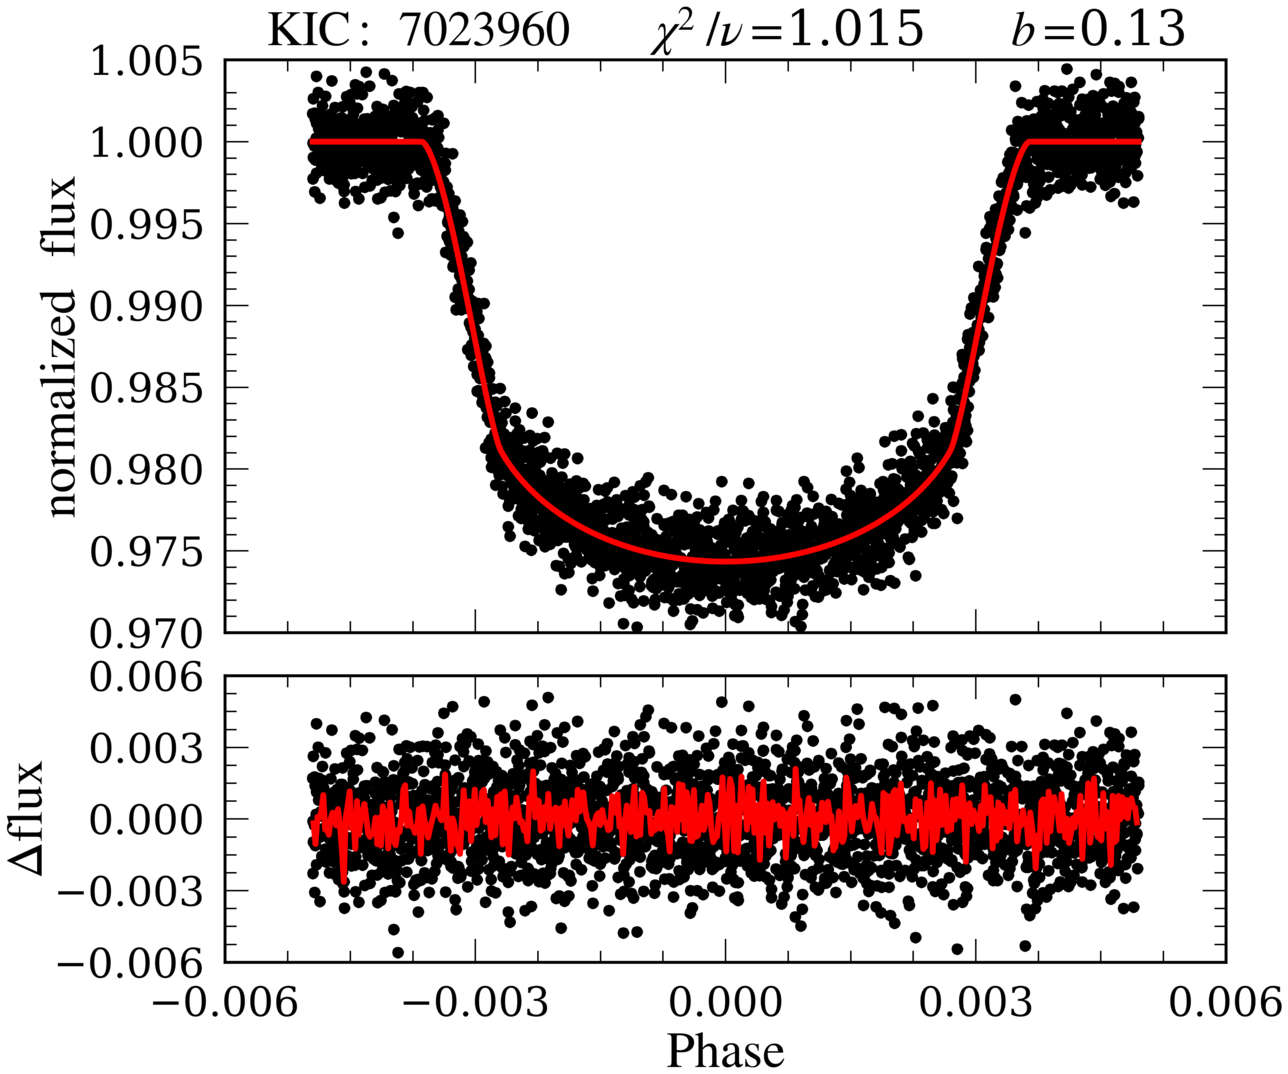
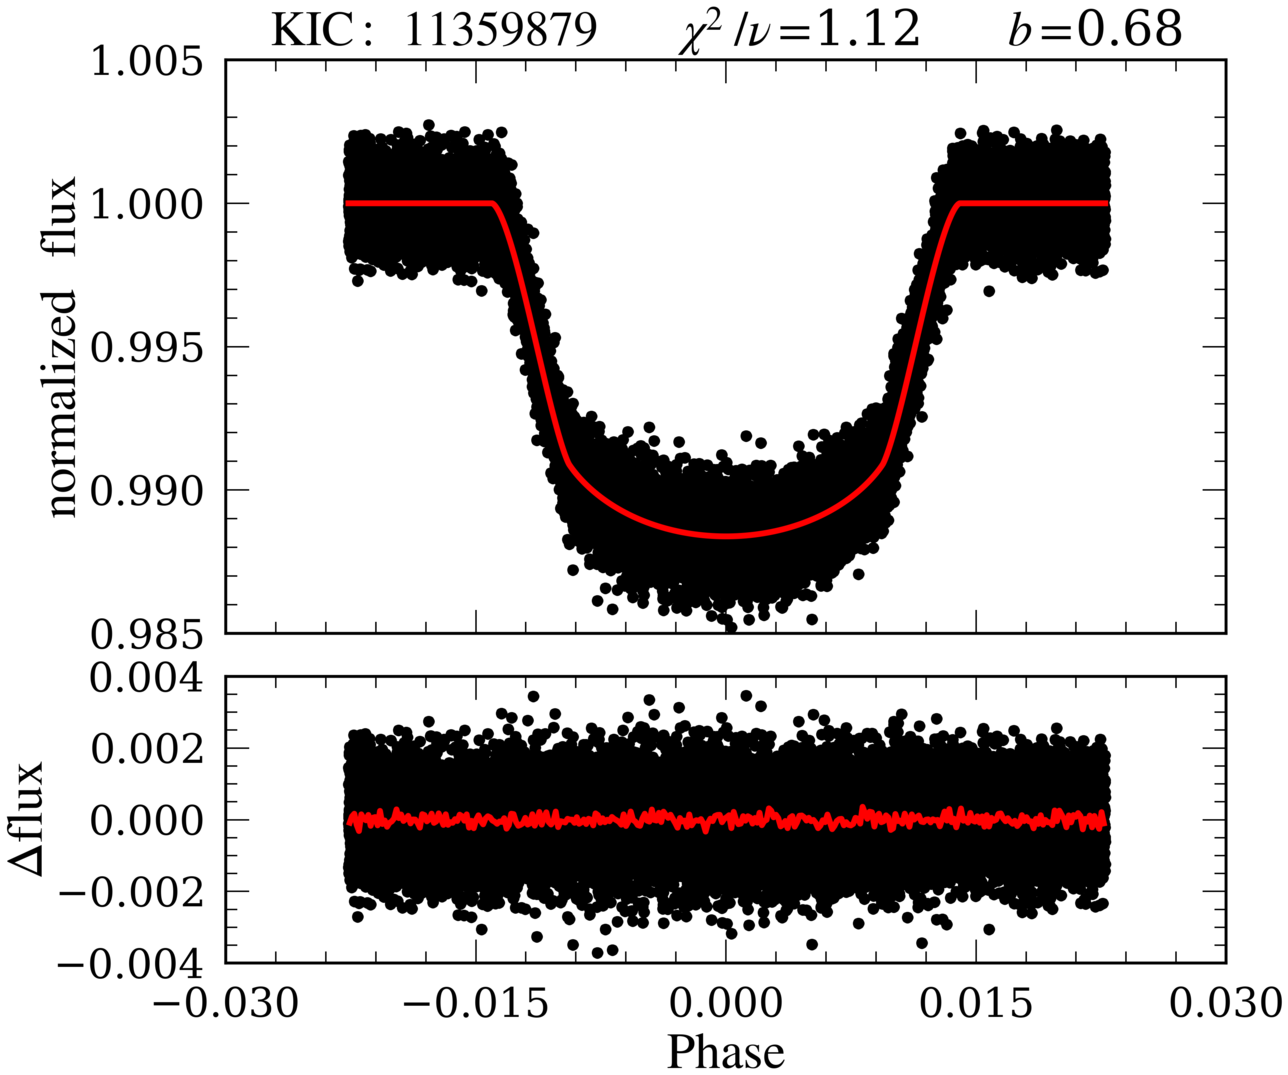
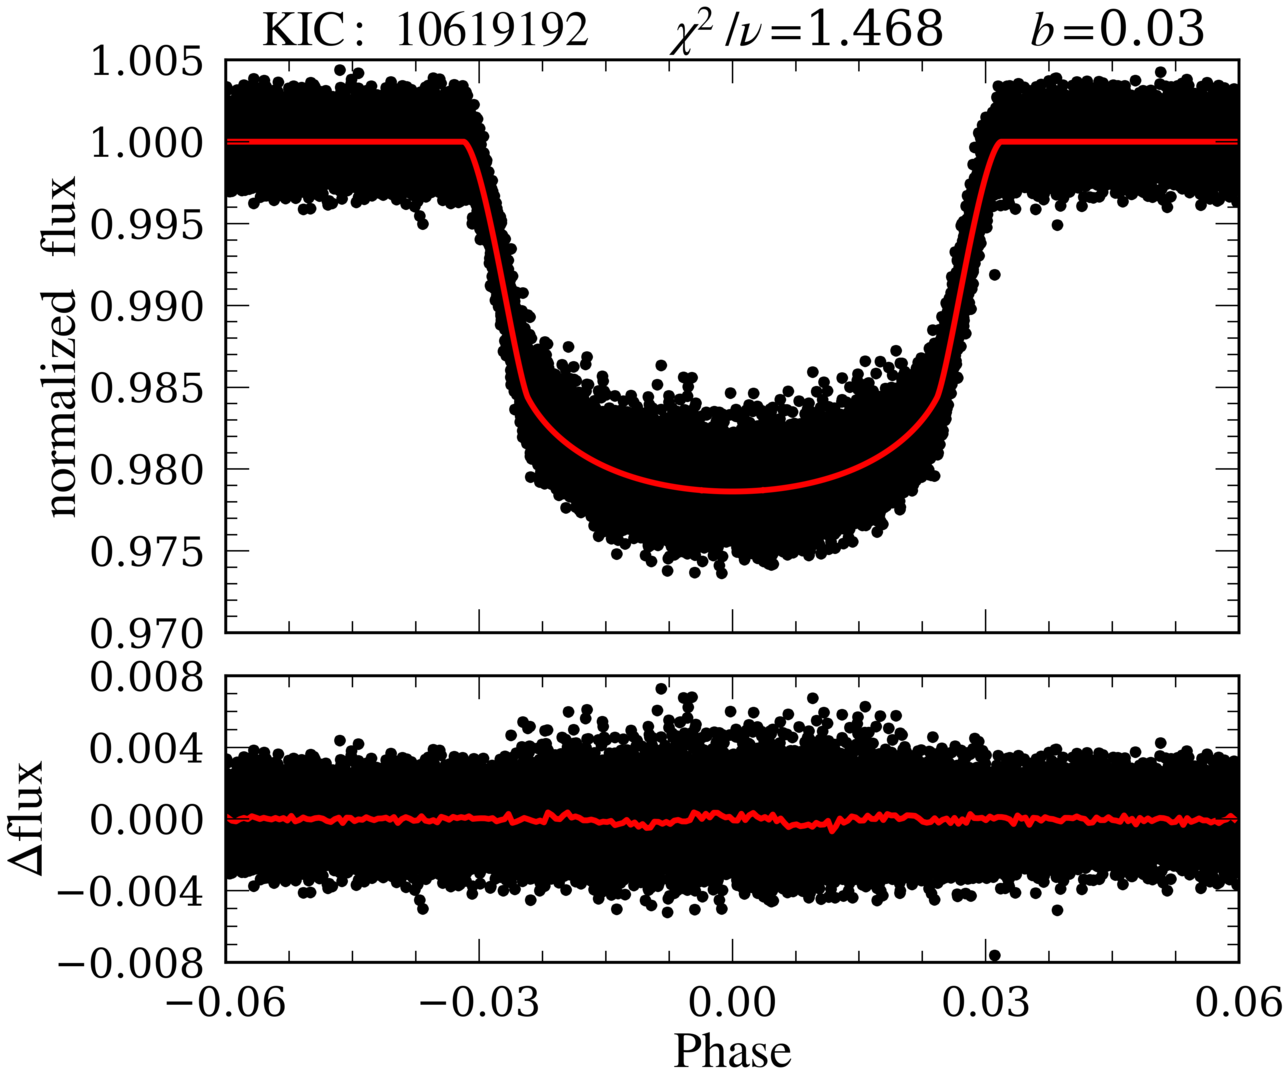
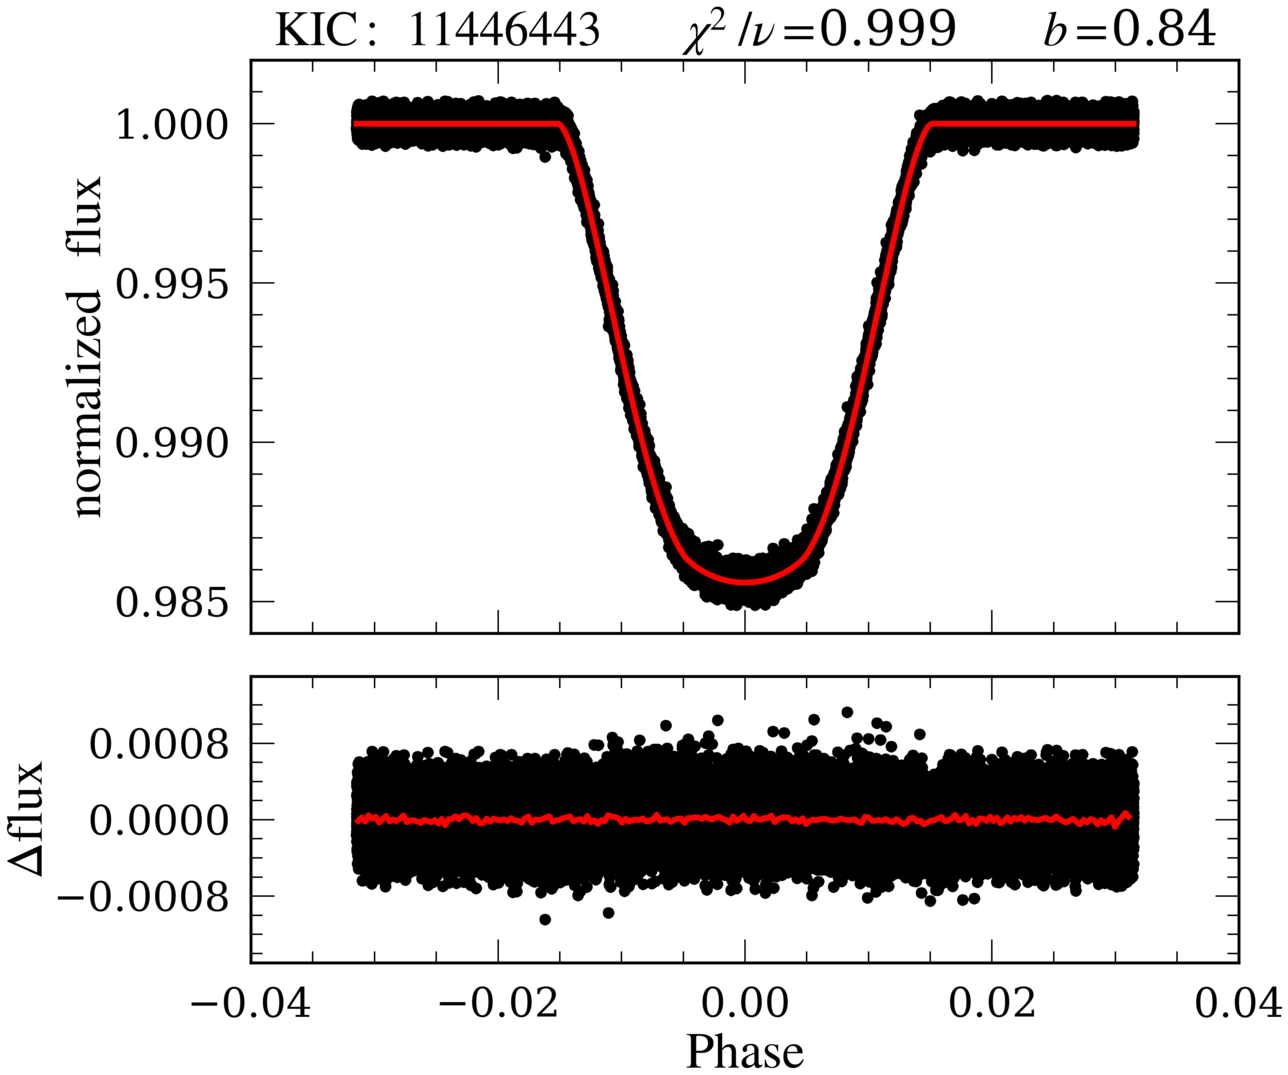
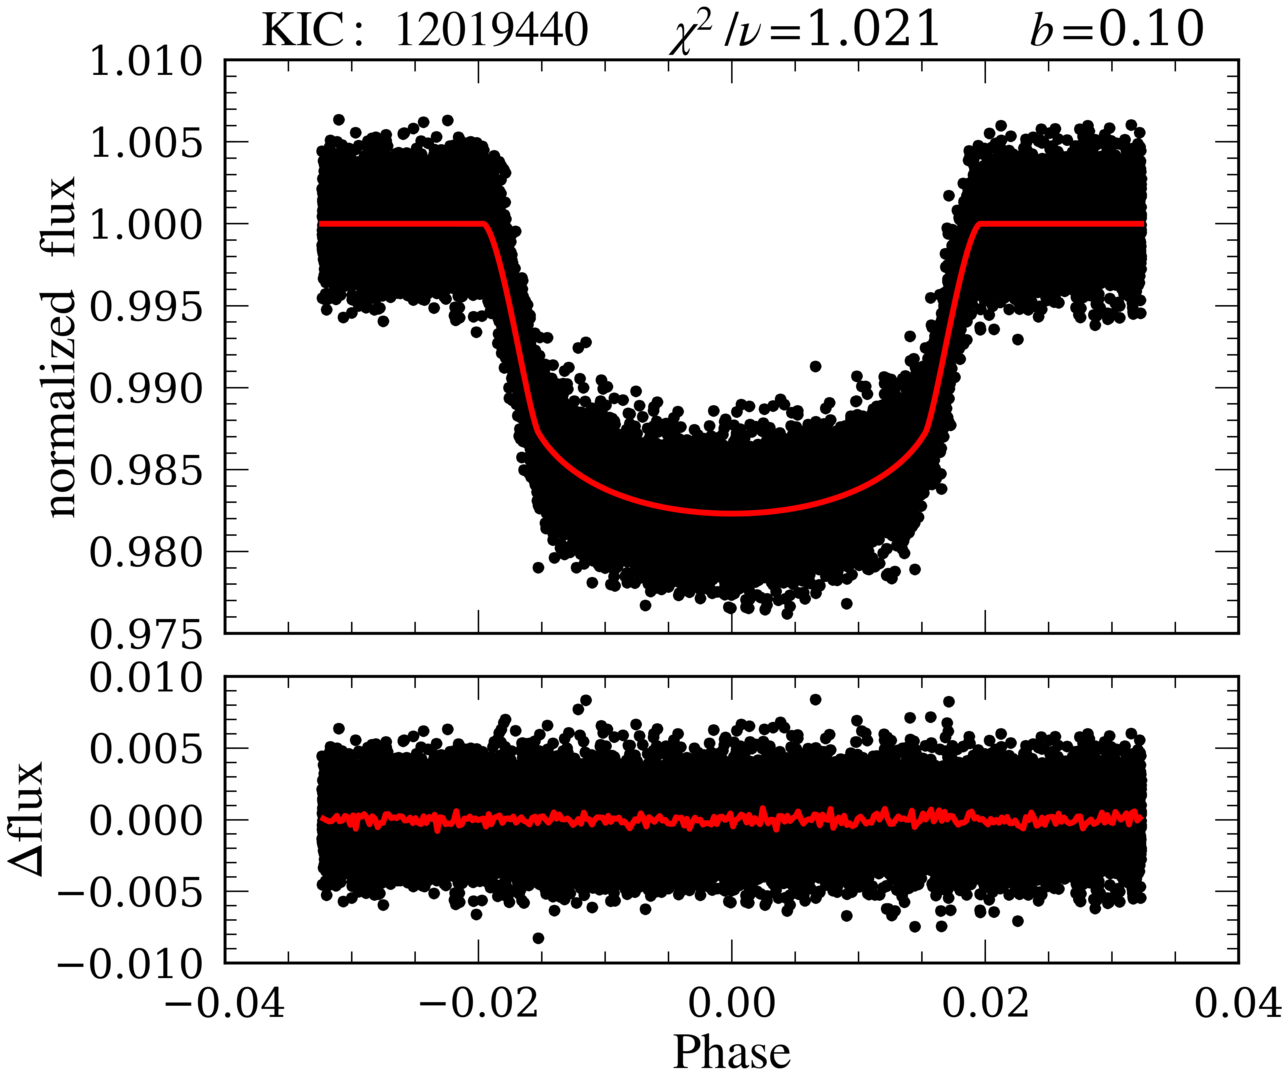
Fig. B.2
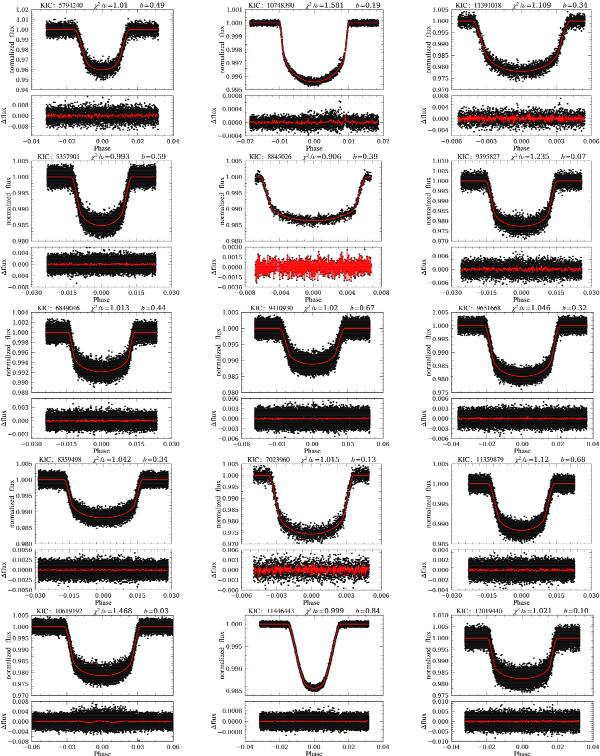
Top panels: normalized, phase folded transit light curves and best-fit models for the high signal-to-noise sample (Table 1). Bottom panels: residuals for individual data points and overplotted rebinned residuals (red) with one minute bin time. Objects ordered by increasing Teff from the upper left to the lower right corner.

Current usage metrics show cumulative count of Article Views (full-text article views including HTML views, PDF and ePub downloads, according to the available data) and Abstracts Views on Vision4Press platform.
Data correspond to usage on the plateform after 2015. The current usage metrics is available 48-96 hours after online publication and is updated daily on week days.
Initial download of the metrics may take a while.