Fig. 9
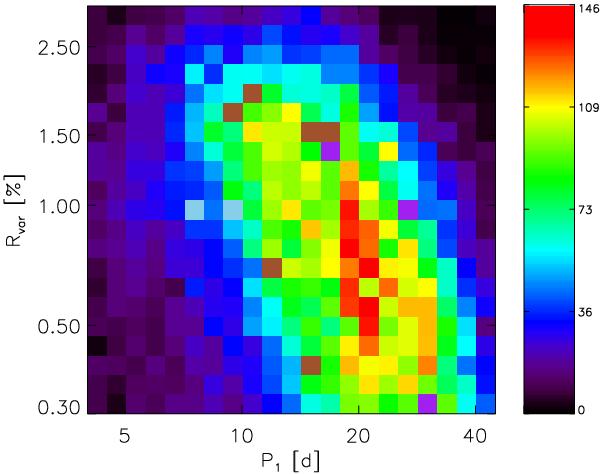
Density plot of rotation periods P1 vs. Rvar with bright regions representing a high density, whereas dark regions express low density. The annotation of the color bar contains the total number of stars in each bin. The distribution shows that the range increases towards shorter periods. Since fast rotators are expected to exhibit an enhanced level of activity, the range could probably be used as proxy for stellar activity.
Current usage metrics show cumulative count of Article Views (full-text article views including HTML views, PDF and ePub downloads, according to the available data) and Abstracts Views on Vision4Press platform.
Data correspond to usage on the plateform after 2015. The current usage metrics is available 48-96 hours after online publication and is updated daily on week days.
Initial download of the metrics may take a while.