Free Access
Fig. 3
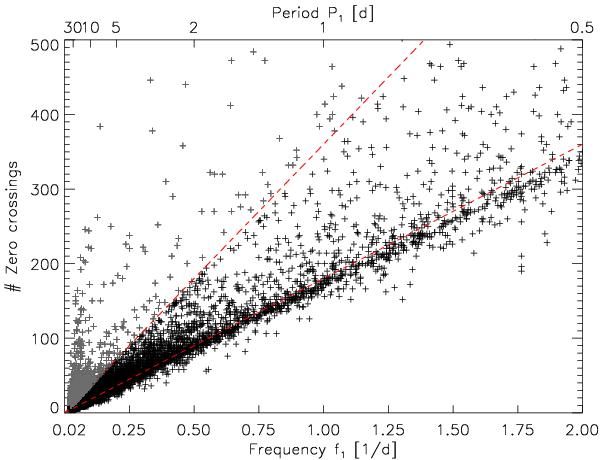
Frequency f1 vs. number of zero crossings in Q3. The lower red line equals the number of zero crossings expected for sine-like variations. Stars lying above the upper red line (gray symbols) were discarded because they show more than twice the number of zero crossings expected.
Current usage metrics show cumulative count of Article Views (full-text article views including HTML views, PDF and ePub downloads, according to the available data) and Abstracts Views on Vision4Press platform.
Data correspond to usage on the plateform after 2015. The current usage metrics is available 48-96 hours after online publication and is updated daily on week days.
Initial download of the metrics may take a while.