Fig. 16
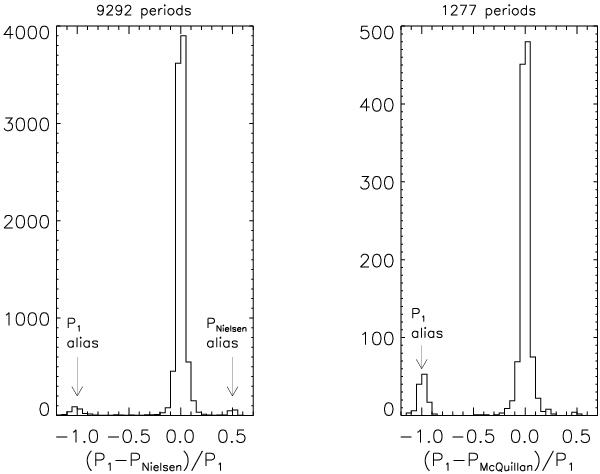
Comparison of periods from Nielsen et al. (2013, left panel) and McQuillan et al. (2013, right panel) with the periods P1 from Fig. 8. We found good agreement with both samples, although the auto-correlation method from McQuillan et al. (2013) was less prone to alias periods than our method, as is obvious from the missing peak around 0.5 in the right panel.
Current usage metrics show cumulative count of Article Views (full-text article views including HTML views, PDF and ePub downloads, according to the available data) and Abstracts Views on Vision4Press platform.
Data correspond to usage on the plateform after 2015. The current usage metrics is available 48-96 hours after online publication and is updated daily on week days.
Initial download of the metrics may take a while.