Fig. 15
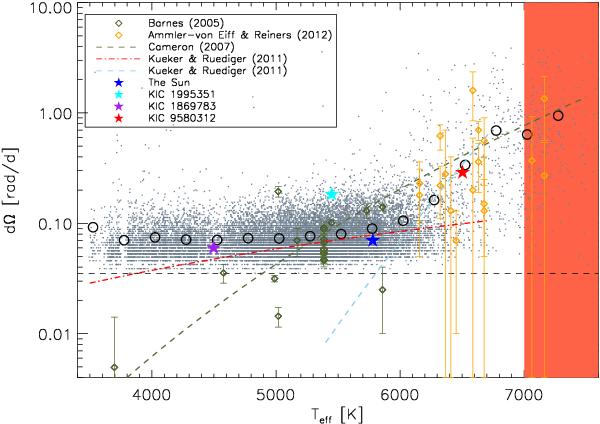
Effective temperature vs. horizontal shear ΔΩ summarizing different measurements: the olive diamonds and error bars were taken from Barnes et al. (2005), the olive dashed curve from Collier Cameron (2007). Orange diamonds and error bars show measurements from Ammler-von Eiff & Reiners (2012). Our measurements are shown as gray dots. The red dash-dotted line and the light blue dashed line show theoretical predictions from Küker & Rüdiger (2011). The black dashed line marks our detection limit. The four stars mark the positions of the Sun (blue), KIC 1995351 (cyan), KIC 1869783 (purple), and KIC 9580312 (red) for comparison. The vertical red bar indicates stars hotter than 7000 K with probable large contamination of pulsators. The open black circles represent weighted means of our measurements for different temperature bins. From 3500−6000 K, ΔΩ shows only weak dependence on temperature. Above 6000 K the shear strongly increases as reported by Barnes et al. (2005) and Collier Cameron (2007). The different behavior of ΔΩ in these two temperature regions was supported by theoretical predictions from Küker & Rüdiger (2011, red and light blue lines).
Current usage metrics show cumulative count of Article Views (full-text article views including HTML views, PDF and ePub downloads, according to the available data) and Abstracts Views on Vision4Press platform.
Data correspond to usage on the plateform after 2015. The current usage metrics is available 48-96 hours after online publication and is updated daily on week days.
Initial download of the metrics may take a while.