Fig. 12
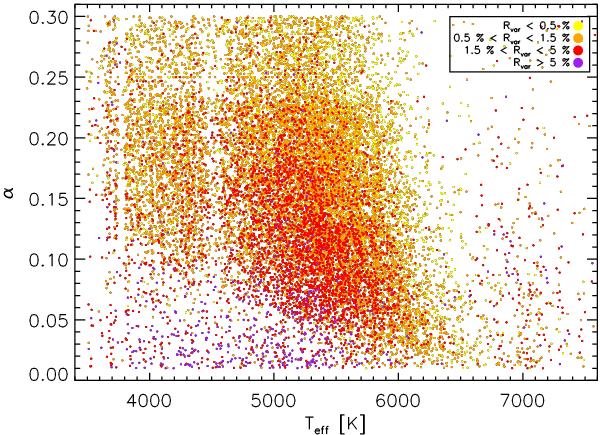
Effective temperature vs. relative shear α. We found that α slightly increases towards cooler stars. The colors indicate different variability ranges. A distinct correlation between α and the range is only visible for the stars with very high ranges Rvar > 5%. These stars group at small α values over a large temperature range. Low α represents short periods, probably indicating that their young age.
Current usage metrics show cumulative count of Article Views (full-text article views including HTML views, PDF and ePub downloads, according to the available data) and Abstracts Views on Vision4Press platform.
Data correspond to usage on the plateform after 2015. The current usage metrics is available 48-96 hours after online publication and is updated daily on week days.
Initial download of the metrics may take a while.