Free Access
Fig. 10
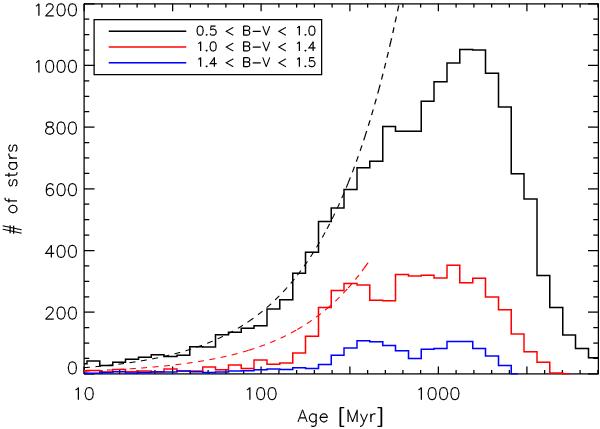
Distribution of ages inferred from rotation periods P1 for different color bins. For B − V > 1.0 (red and blue) we found a bimodal distribution in agreement with McQuillan et al. (2013). The dashed black and red lines show uniform age distributions (on a logarithmic scale).
Current usage metrics show cumulative count of Article Views (full-text article views including HTML views, PDF and ePub downloads, according to the available data) and Abstracts Views on Vision4Press platform.
Data correspond to usage on the plateform after 2015. The current usage metrics is available 48-96 hours after online publication and is updated daily on week days.
Initial download of the metrics may take a while.