Free Access
Fig. 5
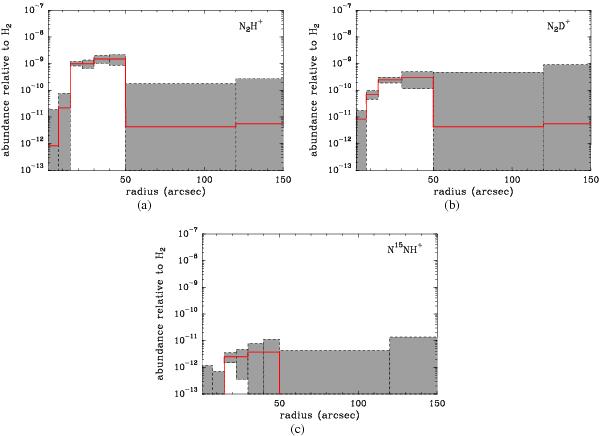
Abundance profiles of the N2H+ isotopologues derived from the modelling (red lines). The shaded areas give a confidence zone for the abundance as delimited by the lower and upper boundaries in each region (see Sect. 3.2 for details).
This figure is made of several images, please see below:
Current usage metrics show cumulative count of Article Views (full-text article views including HTML views, PDF and ePub downloads, according to the available data) and Abstracts Views on Vision4Press platform.
Data correspond to usage on the plateform after 2015. The current usage metrics is available 48-96 hours after online publication and is updated daily on week days.
Initial download of the metrics may take a while.