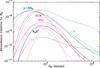
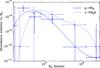
Fig. 21
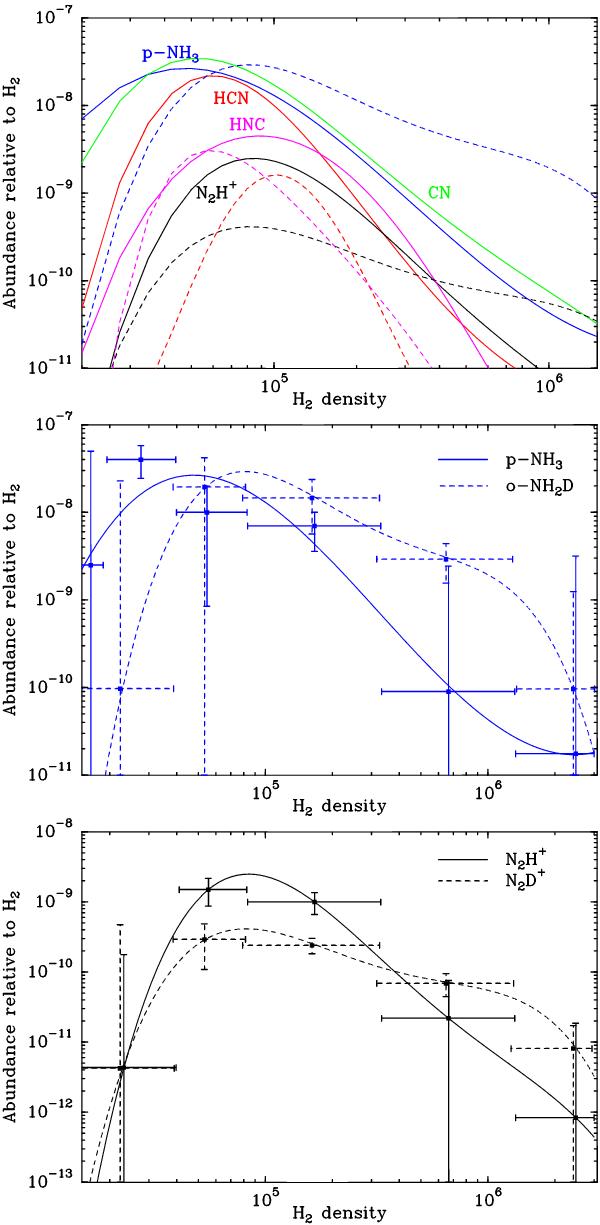
Abundances of the various molecules observed in this study as a function of the H2 density (upper panel). The solid lines show the abundances of the main species and the dashed lines the abundances of the deuterated isotopologues. The abundances are obtained by fitting the step functions used in the RT modelling. The central and bottom panels give the initial points used in the fit, as well as the error bars for NH3 and N2H+.
Current usage metrics show cumulative count of Article Views (full-text article views including HTML views, PDF and ePub downloads, according to the available data) and Abstracts Views on Vision4Press platform.
Data correspond to usage on the plateform after 2015. The current usage metrics is available 48-96 hours after online publication and is updated daily on week days.
Initial download of the metrics may take a while.