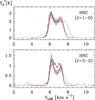
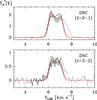
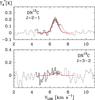
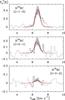
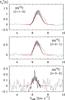
Fig. 14
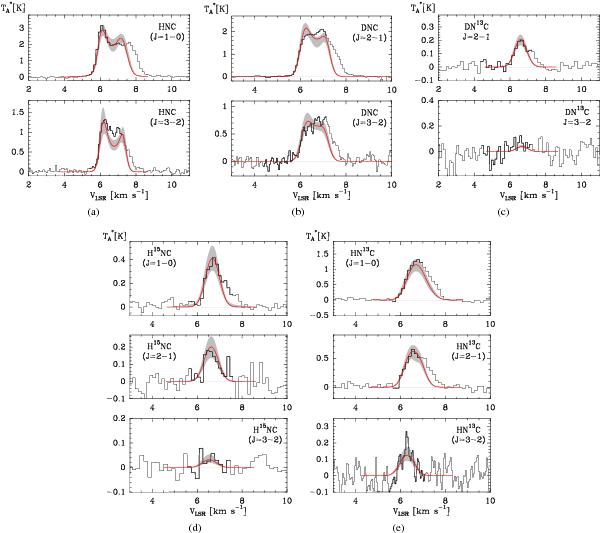
Observed (histograms) and modelled (red lines) spectra for a) HNC (J = 1 − 0) (top panel), and HNC (J= 3 − 2) (bottom panel). b) DNC (J = 2 − 1) (top panel), and DNC (J = 3 − 2) (bottom panel). c) DN13C (J = 2 − 1) (top panel), and DN13C (J = 3 − 2) (bottom panel). d) H15NC (J = 1 − 0) (top panel), H15NC (J = 2 − 1) (middle panel), and H15NC (J = 3 − 2) (bottom panel). e) HN13C (J = 1 − 0) (top panel), HN13C (J = 2 − 1) (middle panel), and HN13C (J = 3 − 2) (bottom panel).
Current usage metrics show cumulative count of Article Views (full-text article views including HTML views, PDF and ePub downloads, according to the available data) and Abstracts Views on Vision4Press platform.
Data correspond to usage on the plateform after 2015. The current usage metrics is available 48-96 hours after online publication and is updated daily on week days.
Initial download of the metrics may take a while.