Fig. 10
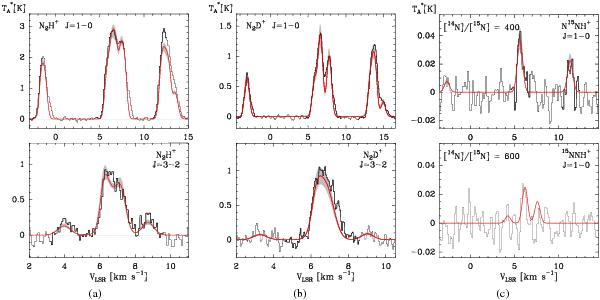
Observed (histograms) and modelled (red lines) spectra for a) N2H+ (J = 1 − 0) (top panel), and N2H+ (J = 3 − 2) (bottom panel). b) N2D+ (J = 1 − 0) (top panel), and N2D+ (J = 3 − 2) (bottom panel). c) N15NH+ (J = 1 − 0) (top panel), and 15NNH+ (J = 1 − 0) (bottom panel). The shaded areas correspond to the variations expected from the error bars set on the abundance profiles and represented in Fig. 5.
Current usage metrics show cumulative count of Article Views (full-text article views including HTML views, PDF and ePub downloads, according to the available data) and Abstracts Views on Vision4Press platform.
Data correspond to usage on the plateform after 2015. The current usage metrics is available 48-96 hours after online publication and is updated daily on week days.
Initial download of the metrics may take a while.