Fig. 1
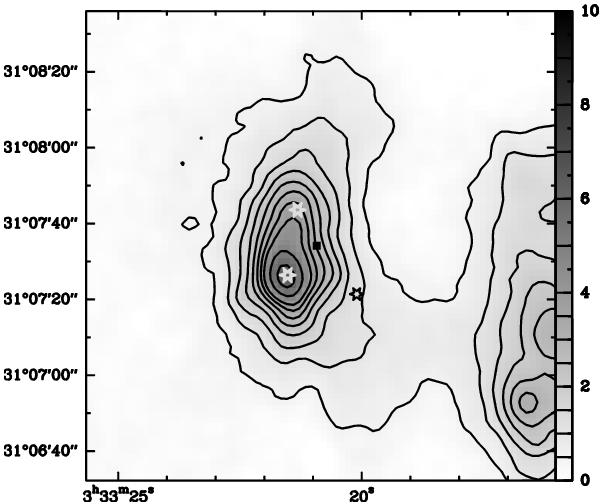
Continuum map at 350 μm obtained at the CSO with the SHARC instrument. The contours have a step of 0.5 Jy/beam from 0.5 to 4 Jy/beam and 1 Jy/beam for larger fluxes (see scale on the right). The white stars indicate the position of B1-bS and B1-bN and the black star corresponds to the Spitzer source [EDJ2009] 295. The black square gives the position of our molecular survey.
Current usage metrics show cumulative count of Article Views (full-text article views including HTML views, PDF and ePub downloads, according to the available data) and Abstracts Views on Vision4Press platform.
Data correspond to usage on the plateform after 2015. The current usage metrics is available 48-96 hours after online publication and is updated daily on week days.
Initial download of the metrics may take a while.