Fig. 3
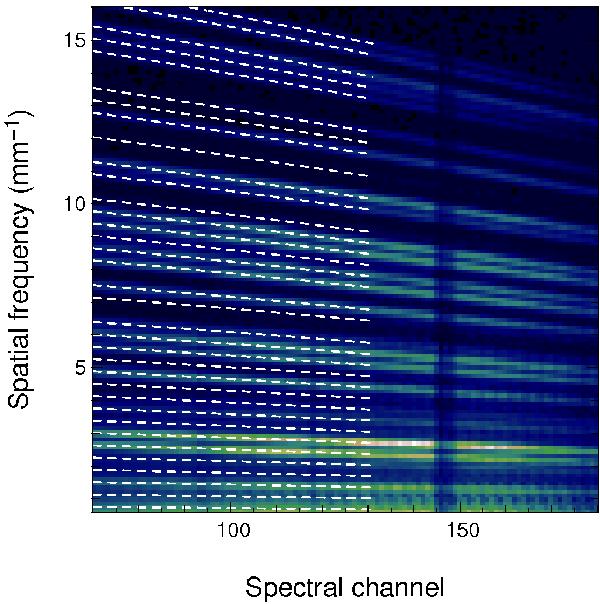
Mean power spectral density computed from 5000 50 ms-images for Capella on 2011 Oct. 16 using data from a single V-groove. The color-scale has been adjusted by discarding the zero-frequency peak (not visible in the image). The fitted peak positions are superposed as dashed white lines only on the left part of the image for better visibility. The (telluric) absorption line appearing at spectral channel number 147 is exactly vertical, showing that the distortion in the image has been effectively corrected. At least 27 different peaks are clearly visible out of the 36 expected ones.
Current usage metrics show cumulative count of Article Views (full-text article views including HTML views, PDF and ePub downloads, according to the available data) and Abstracts Views on Vision4Press platform.
Data correspond to usage on the plateform after 2015. The current usage metrics is available 48-96 hours after online publication and is updated daily on week days.
Initial download of the metrics may take a while.