Fig. 9
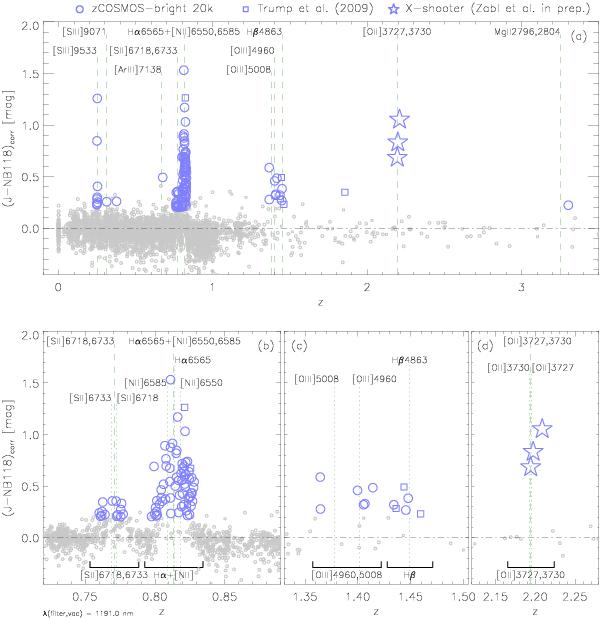
Narrow-band colour versus spectroscopic redshift. The large blue symbols are objects with significant narrow-band excess (Sect. 5.1). The symbol type indicates the spectroscopic catalogue, as per the legend given on the figure. The redshifts of strong emission lines or emission line blends selected by the NB118 filters are marked for a typical filter vacuum wavelength of 1191 nm (but note that the central wavelengths of the filters in the 4 columns of the stack differ somewhat, see the bottom row of Fig. 4). Panels b), c) and d) provide zooms, in which the dashed lines mark the line blends as shown in panel a), while the dotted lines mark the individual lines that are part of the line blends. The horizontal lines mark the redshift ranges used to define the different lines or line blends in Table 2 and in Fig. 8. The low values of the colour at z ≈ 0.9 (see panels a) and b)) are due to the Hα line being in the J band but not in the NB118.
Current usage metrics show cumulative count of Article Views (full-text article views including HTML views, PDF and ePub downloads, according to the available data) and Abstracts Views on Vision4Press platform.
Data correspond to usage on the plateform after 2015. The current usage metrics is available 48-96 hours after online publication and is updated daily on week days.
Initial download of the metrics may take a while.