| Issue |
A&A
Volume 560, December 2013
|
|
|---|---|---|
| Article Number | A67 | |
| Number of page(s) | 9 | |
| Section | Astrophysical processes | |
| DOI | https://doi.org/10.1051/0004-6361/201321801 | |
| Published online | 06 December 2013 | |
Neutrino signal from extended Galactic sources in IceCube
1 Département d’astronomie, Université de Genève, 1290 Versoix, Switzerland
e-mail: This email address is being protected from spambots. You need JavaScript enabled to view it.
2 Département de physique nucléaire et corpusculaire, Université de Genève, 1211 Genève 4, Switzerland
Received: 28 April 2013
Accepted: 8 October 2013
Abstract
Context. The Galactic plane is the brightest source of γ rays in the sky. It should also be one of the brightest very-high-energy neutrino sources, if a neutrino flux comparable to the γ-ray flux is produced by the cosmic ray interactions in the interstellar medium.
Aims. We explore the detectability of the neutrino flux from the entire Galactic plane or from a part of it with the IceCube neutrino detector.
Methods. We calculated the normalization and the spectral index of the neutrino power-law spectrum from different regions of the Galactic plane, based on the observed spectral characteristics of the pion decay γ-ray diffuse emission observed by the Fermi/LAT telescope in the energy band above 100 GeV. We compared the neutrino flux calculated in this way with the sensitivity of IceCube for the detection of extended sources.
Results. Assuming a binned extended source analysis method, we find that the only possible evidence of neutrino emission for sources located in the northern hemisphere after 20 years of exposure is from the Cygnus region. For other parts of the Galactic plane even a 20 year exposure with IceCube is not sufficient for the detection. Taking into account marginal significance of the detectable source in the Cygnus region, we find a precise position and size of the source region that optimizes the signal-to-noise ratio for neutrinos. We also calculated the low-energy threshold above which the neutrino signal can be detected with the highest signal-to-noise ratio. This calculation of precise source position, size, and energy range, based on the γ-ray data, can be used to remove the so-called trial factor in the analysis of the real neutrino data of IceCube. We notice that the diffuse neutrino emission from the inner Galactic plane in the southern hemisphere is much brighter. A neutrino detector with characteristics equivalent to IceCube, but placed at the northern hemisphere (such as KM3NeT), would detect several isolated neutrino sources in the Galactic plane with just a five-year exposure at the 5σ level. Their discovery would identify the cosmic ray sources in the Galaxy that have been active during the last 104 years.
Conclusions. The detection of the diffuse neutrino emission from cosmic ray interactions in the Galactic disk is challenging, but marginally feasible with a 20 year exposure by IceCube. Dramatically shorter (2–5 yr) exposure times would be required for the Galactic plane signal detection with an IceCube-like neutrino detector in the northern hemisphere.
Key words: astroparticle physics / neutrinos / cosmic rays / gamma rays: ISM
© ESO, 2013
1. Introduction
The Galactic plane of our Milky Way Galaxy is the brightest source of γ-rays (Kraushaar et al. 1972; Fichtel et al. 1975; Bloemen et al. 1984; Hunter et al. 1997; Ackermann et al. 2012; Aharonian et al. 2005c). The γ-ray emission from the Galaxy originates mainly from the interactions of the cosmic rays with the gas (i.e., protons) of the interstellar medium. These interactions result in the production of neutral and charged pions which subsequently decay into γ-rays, electrons/positrons, and neutrinos (Dermer 1986; Stecker 1979). The overall power and spectral characteristics of the γ-ray and neutrino emission produced by the broad-band distribution of cosmic rays in proton-proton interactions are very similar to each other (Stecker 1979; Kamae et al. 2006; Kelner et al. 2006).
The γ-ray emission from the decay of neutral pions is directly observed in the 0.1–100 GeV band by the Large Area Telescope (LAT) on board of the Fermi satellite (Ackermann et al. 2012). At the higher energies, the ground based γ-ray telescopes, H.E.S.S., MAGIC, and VERITAS, have recently started to explore the Galactic plane. The H.E.S.S. survey of the inner part of the Galactic plane has revealed a number of bright extended γ-ray sources (Aharonian et al. 2005c, 2008), but no continuous diffuse emission from the entire Galactic plane, except for the Galactic ridge region (Aharonian et al. 2006b). The same bright extended sources are also seen in the survey of the Galactic plane above 100 GeV performed by Fermi/LAT (Neronov & Semikoz 2012). The appearance of isolated extended sources in the Galactic plane above 100 GeV, rather than a continuous emission due to synchrotron and inverse Compton of leptons, could be explained if cosmic rays take about 10% of the average energy of ~ 1051 erg of an average number of one supernova explosion per century. In this case, the shorter escape time of cosmic rays with energies above ~ 1 TeV (compared to lower energy cosmic rays) from the Galactic disk does not allow them to spread homogeneously throughout the disk (Aharonian 2004; Neronov & Semikoz 2012). By locating the extended sources of pion decay γ-ray emission in the E > 100 GeV band one gets a possibility to identify all the places in which injection of cosmic rays has happened over the last 104 − 105 yr. It is possible that the extended sources in the Galactic plane revealed in the E > 100 GeV band by Fermi/LAT and by the ground-based γ-ray telescopes are in fact the places of recent injections of E > 1 TeV cosmic rays in the Galaxy (Neronov & Semikoz 2012). Verification of this hypothesis implies establishment of the hadronic nature of these sources. The most straightforward way to verify if the observed γ-ray emission from these sources is produced by cosmic ray interactions would be to detect a very-high-energy (VHE) neutrino flux from these sources.
Until recently, the sensitivity of detectors of VHE neutrinos (AMANDA and ANTARES) was not sufficient for the detection of neutrinos from astronomical sources, including the extended sources in the Galactic plane. The situation has changed with the completion of the construction of the IceCube neutrino telescope (Abbasi et al. 2011). The IceCube sensitivity to neutrino fluxes is comparable to that of the existing space and ground-based γ-ray telescopes, although in a somewhat higher energy band (TeV-PeV, rather than GeV-TeV). As shown in another paper (Tchernin et al. 2013) the sensitivity of the IceCube is comparable to the observed gamma fluxes.
The unambiguous relation between the γ-ray and neutrino emission from cosmic ray interactions with the gas in the interstellar medium of the Milky Way makes it possible to obtain a reliable estimate of the flux and spectrum of the neutrino signal from the Galactic plane (Stecker 1979). Information on the γ-ray emission from the Galactic plane is available up to the ~ 100 GeV energy band, i.e. at about the energy threshold of IceCube. This means that the expected neutrino signal from the Galactic plane in IceCube can be predicted accurately. We investigate if this signal from the Galactic plane is detectable within a multi-year exposure of IceCube.
Previous studies of the detectability of the diffuse neutrino signal from the Galactic plane based on SAS-2 (Stecker 1979), COS-B (Berezinsky et al. 1993), and EGRET γ-ray data at lower energies (Evoli et al. 2007) suffered from a large uncertainty of extrapolation of the γ-ray data to the multi-TeV energy band in which VHE neutrino telescopes are most sensitive. A general conclusion of the early estimates (Stecker 1979; Berezinsky et al. 1993; Evoli et al. 2007) is that the detection of the diffuse neutrino emission from the Galaxy is a challenging task even for the km3 type neutrino detector.
A detailed calculation of the neutrino flux from the Cygnus region was carried out based on the MILAGRO γ-ray data in the multi-TeV band (Anchordoqui et al. 2007; Beacom & Kistler 2007; Taylor et al. 2008). The common conclusions of these works is that the Cygnus region is detectable within a decade of data taken by IceCube.
For example, Halzen et al. (2008) predicted the extented neutrino emission using the Milagro source fluxes detected with average energy of 3 TeV. Three of these sources are in the Cygnus region. A stacked signal from these sources could be detected if, as in Halzen et al. (2008), we assume a spectral index of 2.1 and energy cut-off of about 600 TeV. Recent γ-ray observations have reported much lower energy cut-offs for these sources Abdo et al. (2012), while also not confirming one of the candidates as a real source (significance <3σ). One should note, however, that the MILAGRO sources could well be just the brighter spots of the extended emission in the entire Cygnus region (as suggested by the Fermi data, see below). In this respect, the spectra of the brighter TeV spots are not representative for the overall emission spectrum of the entire region.
Limits on the neutrino emission from point sources in the Cygnus region have been set by Abbasi et al. (2011). In addition, a dedicated scan for point sources in the Galactic plane region was also performed by the IceCube collaboration team (Abbasi et al. 2013), and a search optimized for multiple and extended sources in the Cygnus region was done as well. This search was based on the data of the 22-string and 40-string configurations of IceCube together with the AMANDA data. In both cases no evidence of a neutrino signal was found, but the collaboration team set the most stringent 90% confidence level muon neutrino flux upper limits in the visible northern sky for soft-spectra point sources to be in the range E3dN/dE ~ 5.4 − 19.5 × 10⁻¹¹ TeV2 cm-2 s-1. Moreover, limits are reported for the Cygnus region of about 0.7 (5) × 10-11 TeV-1 cm-2 s-1 (E/TeV)−γ for E−γ and γ = 2 (3).
In what follows we investigate the perspectives for the detection of a neutrino signal from the Galactic plane with IceCube, based on the measurement of the π0 decay γ-ray signal by Fermi/LAT. We calculate the sensitivity of IceCube for extended sources with different spectral characteristics generalizing a previously developed method (Neronov & Ribordy 2009) tested on the published IceCube data for point sources (Tchernin et al. 2013). We then apply this method to the IceCube detector and study which part of the Galactic plane located in the northern hemisphere could be detected within a given exposure time. Taking into account that the brightest part of the Galaxy, including the Galactic center region, is located in the southern hemisphere, we also study the detectability of the neutrino signal from the Galaxy with a detector that has characteristics equivalent to IceCube, but is situated at the north pole. We find that such a detector would have a rich astronomical observations program, with some ~ 3 extended Galactic sources detectable within a relatively short exposure (five years). This provides a strong argument in favor of the deployment of the km3 scale VHE neutrino detector in the northern hemisphere, like KM3NeT (KM3NeT Consortium 2012).
2. The VHE neutrino signal from the Galactic plane
The VHE neutrino signal from the Galactic plane can be reliably estimated based on the observed γ-ray signal in the GeV energy band, which lies below the energy band in which IceCube is most sensitive. A complete picture of the γ-ray emission from the Galactic plane in the energy band above 100 GeV is provided by the Fermi/LAT observations that cover the entire Galactic plane with approximately homogeneous exposure of ≃4 yr.
Figures 1 and 2 show the profiles of the intensity of the emission from the Galactic plane as a function of Galactic longitude for circular regions of radii 2° and 4° around each Galactic longitude of the Galactic plane. In the energy band above 10 GeV the signal from the Galactic plane is dominated by the diffuse emission, with only the minor contribution from the point sources (e.g. pulsars, which have high-energy cut-offs in the E ≤ 10 GeV range). To produce these figures we have used the LAT data collected over the period from August 2008 to October 2012. We filtered the LAT events using the gtselect and gtmktime tools, following the recommendations of the LAT collaboration1, and retained only events belonging to the so-called clean class (evclass=3) which are most likely γ-rays. We estimated the flux by dividing counts by exposure calculated using the gtexposure tool.
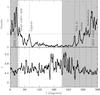 |
Fig. 1 Profiles of the intensity (top) and the spectral index (bottom) of the γ-ray power-law emission in the energy band above 100 GeV. Fermi/LAT counts are collected from the circular regions of radius Ψ = 2° around each Galactic longitude of the Galactic plane. The fluxes are normalized on the flux from the Cygnus region at longitude l = 80°. The shaded region marks the part of the Galactic plane in the southern hemisphere. Vertical lines with the names show locations of bright extended VHE γ-ray sources. |
From these figures one can see that the brightest emission from the Galactic plane in the northern hemisphere comes from two equally bright locations: a region at approximately zero declination (Galactic longitude ≃33°, around HESS J1857+028), and from the Cygnus region at Galactic longitude ≃80°. This indicates that the Galactic plane neutrino signal in IceCube will appear as isolated extended excesses at the positions of the Cygnus region and/or l = 33°. If one aims at the initial discovery of the neutrino emission from the Galaxy, it appears reasonable to concentrate on the detection of the emission from the Cygnus region and/or l = 33°. Considering a larger part of the Galactic plane would just dilute the excess from these two regions through the addition of a stronger background (generated by atmospheric neutrinos) without a significant increase in the signal.
The calculation of the neutrino signal in IceCube from the γ-ray data requires the knowledge of the normalization A100 of the neutrino flux at 100 GeV, and also of the spectral index Γ of the neutrino spectrum: 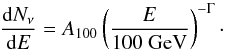 (1)To convert the normalization of the γ-ray signal to the muonic neutrino signal produced during proton-proton interactions, we use the relation expressed in Kappes et al. (2007). As the spectral index for neutrinos from pion decays is nearly identical to that of the γ-rays, we can derive it directly from the γ-ray data. The bottom panels of Figs. 1 and 2 show the spectral index of the neutrino/γ-ray spectrum derived from the ratio of the integrated fluxes N10 − 31.6 and N31.6 − 100 in the 10–31.6 GeV and 31.6–100 GeV energy ranges (i.e. from the hardness ratio between the two bands):
  (2)It is clear that a harder spectrum (lower Γ values) implies a higher neutrino flux in the energy range above ~ 1 TeV, in which the IceCube detector is most sensitive. From Figs. 1 and 2 one can see that of the two strongest 100 GeV excesses, the Cygnus region spectrum is harder than that corresponding to the excess located at l = 33°. Therefore the neutrino signal in IceCube from the direction of Cygnus should be significantly stronger than that from the l = 33° region.
Thus, the Cygnus region should be considered the best candidate for the possible IceCube discovery of the neutrino signal from the cosmic ray interactions in the Galactic disk. Taking this into account, an additional optimization of the parameters of the IceCube observation of the Cygnus region based on the γ-ray data appears reasonable.
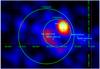 |
Fig. 3 Fermi/LAT countmap of the Cygnus region in the energy band above 100 GeV, smoothed with a Gaussian kernel of 1 degree. The regions indicated by the green circles are used for the spectral extraction of Fermi/LAT data and have radii of 2 and 4 degrees (from small to large). Positions and names on known VHE γ-ray sources are marked. |
2.1. The neutrino signal from the Cygnus region
Figure 3 shows the Fermi/LAT countmap of the Cygnus region in the energy band above 100 GeV, smoothed with a 1 degree Gaussian to highlight the extended structures. The dominant source in this energy band is the γ-Cygni supernova remnant, which contains a pulsar wind nebula and a shell-type supernova remnant. The overall extent of the remnant is about 1°. The source is detected both by the space-based telescope Fermi/LAT (Ackermann et al. 2011) and ground-based telescope VERITAS (Weinstein et al. 2011). At the energies below ~ 10 GeV, the emission from the source is strongly dominated by the pulsed magnetospheric emission from the pulsar PSR J2021+4026 (Abdo et al. 2009). Above 10 GeV the pulsed emission is strongly suppressed and a separate power-law-type emission component is present.
The spectrum of the γ-ray emission from a circular region of radius Ψ = 1° centered on the γ-Cygni supernova remnant position is shown in Fig. 4. To extract the spectrum, we used the so-called aperture photometry method. We estimated the diffuse background at the source position from two regions at the same Galactic latitude, but displaced by five degrees from the source region. From Fig. 4 one can clearly see the presence of the new power-law-type component in the spectrum above 10 GeV. The flux from this component is detected at least up to 300 GeV in Fermi/LAT. Taking into account the detection of the source by VERITAS, one can conclude that the power-law component extends up to the TeV energy band.
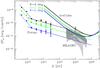 |
Fig. 4 Data points: Fermi/LAT spectra of the 1, 2 and 4 degree regions in the Cygnus region (from bottom to top). Straight lines show fits to the spectra with extrapolations to higher energies. Curves represent the 90% confidence level. sensitivities of IceCube (2 yr exposure) for the extended sources of the size 1, 2 and 4 degree (from bottom to top) for all neutrino flavors, assuming that at Earth, after oscillations, the muonic neutrino flux is one third of the total neutrino flux (Learned & Pakvasa 1995). The horizontal hatched region shows the spectrum of the VHE γ-ray source MGRO J2019+37. The vertical hatched region shows the spectrum of MGRO J2031+41. The gray shading shows the sum of the fluxes of MGRO J2019+37 and MGRO J2031+41 (Abdo et al. 2012); both sources are within the 4 degree source region considered for spectral extraction in Fermi/LAT. |
The same power-law component is present also on a larger angular scale. Figure 4 demonstrates that the flux of this component accumulates on the angular scales Ψ = 2° and on the scale of Ψ = 4°. The spectral index of the power-law Γ ≃ 2.4 remains remarkably stable on different angular scales. This power-law component was previously noticed by Ackermann et al. (2011), who interpreted this hard component as being produced by the freshly accelerated cosmic rays in the Cygnus region. This interpretation automatically implies the presence of the hard spectrum neutrino emission from this region, with flux and spectral index nearly identical to the γ-ray flux.
No sign of high-energy cut-off of this component is found in the Fermi data. Moreover, observations of the region in the multi-TeV energy band by VERITAS (Weinstein et al. 2009) and Milagro (Abdo et al. 2007) reveal a strong emission at the energies up to tens of TeV. The measurement of the flux of multiple sources in the Cygnus region seen by MILAGRO in the 10 TeV band agrees well with a simple power-law extrapolation of the Fermi/LAT spectrum of extended emission from the Cygnus region. This agreement allows us to make a conjecture that the emission found by MILAGRO is just the high-energy counterpart of the cosmic ray powered γ-ray emission from the freshly accelerated cosmic rays injected either by the Cygnus OB2 association (Ackermann et al. 2011) or by the γ-Cygni/PSR J2021+4026 composite supernova remnant (Neronov & Semikoz 2012). Furthermore, the combination of these long-term experiments seems to show that this observed spectrum can be stable over a long period of time.
Since the bulk of the γ-ray emission from the Cygnus region is produced via cosmic ray interactions with the gas in the interstellar medium, the strength and the spectrum of the neutrino signal, and its imaging characteristics, can be derived directly from the γ-ray data. We have inspected the γ-ray data with the goal of localizing the circular source regions of the radii Ψ = 1°,2°, and 4°, which produce the highest γ-ray (and hence neutrino) signal above 100 GeV. Figures 5 and 6 show the locations of the highest signal circles on the sky. Table 1 lists the positions and expected neutrino fluxes of these circles. The information of these two a priori coordinates of highest signal could be useful for IceCube to maximize the strength of the neutrino signal by correctly localizing the region used as the source region in the analysis of the data, and limiting in this way the trial factor associated with scanning the entire Cygnus region.
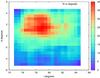 |
Fig. 5 Strength of the γ-ray (and hence neutrino) signal within circles of radius Ψ = 2° at different locations inside the Cygnus region. Each pixel shows the position of the center of the circle. The color scale shows the number of γ-ray counts in the circles. |
Optimal positions and energy thresholds of the source signal regions for the search of neutrino emission from extended regions.
3. The detection of the neutrino signal in IceCube
3.1. IceCube sensitivity
To find if the expected neutrino signal from these regions is detectable by IceCube, we compare the neutrino signal from each region with the atmospheric neutrino background for different energy bands E > Ethr, where Ethr is an adjustable energy threshold for the IceCube data analysis.
The value of Ethr is fixed in such a way that it optimizes the signal-to-noise ratio. The spectrum of the Cygnus region and of the low-declination region with high neutrino flux is harder than that of the atmospheric neutrino background. Therefore, the decrease of the atmospheric neutrino background with the increase in Ethr is faster than the decrease in the signal. At the same time, an increase in Ethr that is too strong reduces the signal to just a few counts, so that the detection efficiency of the source is strongly reduced. The optimal value of Ethr is, therefore, between these two limits. Knowing the spectrum of neutrinos from any location along the Galactic plane from the γ-ray data, we can adjust Ethr as a function of Galactic longitude l in such a way that the signal-to-noise ratio is maximized.
Quantitatively, for each Ethr and each l, we calculate the statistics of the source extended signal by convolving the known source spectrum given by Eq. (1) with the energy- and declination-dependent area of IceCube, Aeff(E,δ),  (3)where T is the exposure time and δ is the source declination, which is a function of the Galactic coordinates (l, b). To simplify the notation, we will only write here the Galactic longitude dependence, because we are focused on the Galactic plane ((l, b = 0°)≡(l)). In the same way we also calculate the background
  (4)where dNatm(δ,E)/(dEdΩ) is the spectrum of the atmospheric neutrinos arriving from a declination δ in a solid angle dΩ (Honda et al. 2006).
We then calculate the Poisson probability to have at least S(l,Ψ) + B(δ,Ψ) neutrino counts from a given direction on the sky while the expected level of the atmospheric neutrino background is B(δ,Ψ). The optimal value of Ethr(l) is chosen to minimize this probability for each Galactic longitude l, with an obvious additional requirement of having at least one signal count, S(l,Ψ) ≥ 1.
3.2. The neutrino signal from the Galactic plane and from the Cygnus region
The results of this optimization procedure for different exposure times of 10 and 20 years, and different choices of the source region circle radius Ψ are shown in Figs. 7–10. In these figures we plot the Poisson probability which measures the inconsistency of the source+background hypothesis (S(l,Ψ) + B(δ,Ψ)) with the background-only hypothesis. The calculations are done for the 79 string (IC-79) configuration of the IceCube detector for which the effective areas were published (Aguilar 2013). The IC-79 effective areas are close to those of the final configuration with 86 strings (IC-86), so that the potential of IceCube for the detection of the neutrino emission from the Galactic plane can be correctly estimated based on the known IC-79 instrument characteristics.
From Figs. 7 and 8 one can see that, as expected, the strongest excess (i.e. the strongest inconsistency with the background-only hypothesis) is found in the Cygnus region. A ten-year exposure is, however, not sufficient for a detection of the Cygnus region at the 3σ level, except if the spectral index remains as hard as the one detected with Fermi at higher energies. As shown in Fig. 8, somewhat surprisingly, the low-declination region at l = 33° with a stronger flux in the 100 GeV band (see Fig. 1) gives a weaker excess. This is explained by a softer spectrum of the source, which results in a lower number of source counts in the IceCube energy range.
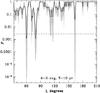 |
Fig. 7 Poissonian probability that the neutrino signal expected from the γ-ray observations are due to the fluctuations of the atmospheric neutrino background for 10 years exposure time with IceCube in the IC-79 configuration and a 2 degree region of interest around each longitude of the galactic plane (l), for the northern hemisphere (l ∈ [34:220] °). A line corresponding to the probability of 3σ has been added to help the readability. Key: in black, the probability using the spectral index computed with the Eq. (2); in grey, the uncertainties of the probability corresponding to 1σ. |
Figures 9 and 10 show that a 20 year exposure of IceCube should be sufficient for a detection of the Cygnus region at 3σ level, for both source regions of radius Ψ = 2° and Ψ = 4° (marginally), centered on the position given in Table 1. The probability of detection is higher if the source region is smaller, which is explained by a higher level of atmospheric neutrino background than signal events in this larger region.
It is important to note that apart from the Cygnus, none of the other regions in the part of the Galactic plane in the northern hemisphere will be detectable even with a 20 year exposure of IceCube in the muon neutrino channel. It appears that the part of the Galactic plane in the northern hemisphere is not a bright neutrino source. In this work, we assume that the spectra of the sources obtained with Fermi stay stable over 10–20 years. Thus, to test our conclusions, long γ-ray monitoring observations attesting the stability of the observed emission spectrum are required. Meanwhile, if the Fermi observations can be combined with observations taken by a long term monitoring experiment like MILAGRO, as in the case for the Cygnus region (see Fig. 4), then this can demonstrate that the source emission was stable over a few years of observation.
3.3. The neutrino signal from the inner Galaxy with a hypothetical detector in the northern hemisphere
The level of neutrino emission from the part of the Galactic plane situated in the northern hemisphere is so low because this part of the Galaxy is mostly in the outer Galaxy direction. Only the Cygnus region is in the direction of the nearby Galactic arm, which increases the column density of the cosmic rays and interstellar medium in this direction. The strongest γ-ray and neutrino signal come from the inner part of the Galactic plane which is entirely situated in the southern hemisphere.
Unfortunately, in the TeV-PeV energy range, the IceCube detector is sensitive to the muon neutrino track signals from sources located in the northern hemisphere (see, e.g., the effective area in Aguilar 2013; Aartsen et al. 2013) so that the brighter part of the Galactic plane is not accessible. The main obstacle for the observations at negative declinations is the strong residual atmospheric muon background that strongly dominates at low energies and effectively increases the energy threshold of IceCube to the PeV region. The spectrum of the Galactic diffuse neutrino emission is relatively soft, so that most of the signal statistics come at the low energy threshold2.
To demonstrate the potential of neutrino astronomy which might be done with a km3 class neutrino detector in the northern hemisphere, we performed an analysis identical to that reported in the previous subsection, but assuming a hypothetical IceCube-like neutrino detector situated at the north rather than the south pole. One candidate for this km3 class neutrino detector in the northern hemisphere is the KM3NeT project to be located in the Mediterranean Sea and which is currently in the design phase (KM3NeT Consortium 2012).
The results of the calculations for the northern IceCube are shown in Figs. 11 and 12 for a five-year exposure. One can see a dramatic difference with the expected IceCube results. A detector identical to IceCube, but in the northern hemisphere would detect some ~ 3 sources at the 5σ level with just five years of operation (compared with the ten to twenty years needed for a 3σ evidence of single source in real IceCube), if the region of interest is of 2 degrees. For some of the detected sources, the imaging analysis might be possible with a five-year data set: one can see that several sources would be significantly detectable in both Ψ = 2° and Ψ = 4° regions. This implies that a limited imaging analysis of the neutrino signal from the southern hemisphere will be possible with a hypothetical IceCube-like neutrino detector situated at the north pole. One will be able to compare the morphology of neutrino and γ-ray signals from this region.
It is interesting to note that the Galactic center itself would not be detected by the northern IceCube. This is explained by the relatively soft spectrum of the source in the Galactic center (see Fig. 2). In general, all the isolated extended sources detectable at the 5σ level within a five-year exposure by the northern IceCube are locations with a hard emission spectrum.
Since neutrinos are not deflected by magnetic fields, the detection of VHE neutrino sources in the inner Galactic plane will provide important information about the location of high energy particle accelerators and it will allow the start of multi-messenger astronomy.
Table 2 summarizes the position and neutrino spectral information of the sources that could be detectable by a neutrino telescope located in the northern hemisphere such as KM3NeT. In the next section these potential neutrino sources will be described.
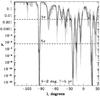 |
Fig. 11 Same as in Fig. 7, but for a hypothetical northern IceCube detector situated at the north pole and sensitive for the sources in the southern hemisphere. For five years of exposure. |
3.4. Neutrino candidate sources located in the southern hemisphere
Sources listed in Table 2 could be sites of recent cosmic ray acceleration. Among them, the HESS J1825-137 is the brightest γ-ray source (see Fig. 1) but with a soft spectral index. On the other hand, Vela Jr. is expected to have the hardest spectrum which will make it detectable at the same level even with a lower flux. In the following we will describe each of these neutrino candidate sources.
The source HESS J1825-137 has been detected with the H.E.S.S. telescope (Aharonian et al. 2005c) as an extended source. This source could be associated with an X-ray pulsar wind nebula G18.0–0.7 (Aharonian et al. 2005b). In de Jager et al. (2005), the authors associate the presence of those two sources with the Vela-like pulsar PSR B1823-13 and explain this emission as a result of a supernova remnant (SNR) expanding and evolving into an inhomogeneous medium.
The supernova remnant Vela Jr., also known as RX J0852.0-4622, is situated at the Galactic coordinate (l = 267°, b = −01.22°). It is one of the most luminous Galactic sources in the VHE energy band. The flux was reported to be of about 10% of Crab at 1 TeV by Katagiri et al. (2005). It was discovered in 1998 using X-ray images performed by ROSAT (Aschenbach 1998). The distance to Vela Jr. has been estimated to be on the order of 200 pc (Aschenbach et al. 1999), which is closer than the Cygnus region. The CANGAROO-II imaging atmospheric Cerenkov telescope detected the source at the 6σ level in 100 h (Katagiri et al. 2005). This source has been also detected by the H.E.S.S. telescope (Aharonian et al. 2005a; Paz Arribas et al. 2011) with a differential γ-ray spectrum that follows a power-law distribution of a spectral index ~2.1. This flux measurement is consistent with the flux obtained at lower energy with the Fermi telescope (see Table 2). According to Aschenbach et al. (1999), this remnant is quite young, with an age of 680 years, and thus could be the site of recently accelerated cosmic rays.
The extended emission detected by the Fermi telescope at Galactic longitude around l = 337–338 has a counterpart at higher energy. The inner Galactic plane survey of H.E.S.S. (Aharonian et al. 2006a) has revealed several sources located in the considered region: HESS J1632-478 (l = 336.38°, b = 0.19°), HESS J1634-472 (l = 337.11°, b = 0.22°), and HESS J1640-465 (l = 338.32°, b = 0.02°).
-
The pulsar PSR J1632-4818 was detected close to the position(l = 336.08°, b = −0.21°), with an age estimated to be on the order of 20 kyr (Manchester et al. 2002). Another close pulsar, PSR J1632-4757, was detected with a spin-down loss of 5 × 1034 ergs/s and a distance of 7 kpc. Both pulsars could be marginally associated to the source HESS J1632-478 (Aharonian et al. 2006a). It seems thus possible that the emission from this region is composed of contributions from many sources.
-
The source HESS J1634-472 was detected during this same survey (Aharonian et al. 2006a) as an extended γ-ray source with a flux of 6% of the Crab Nebula and with a position that agrees with the supernova remnant G337.2+0.1.
-
The γ-ray source HESS J1640-465 has also been observed in the radio band. Using the radio observations at 843 MHz (Whiteoak & Green 1996), the source position coincides roughly with the supernova remnant G338.3-0.0, while using the X-ray observations obtained with Chandra (Lemiere et al. 2009) and XMM (Funk et al. 2007), together with the γ-ray observation obtained with Fermi (Slane et al. 2010), the detected emission seems to be associated with a pulsar wind nebula.
The listed sources are most probably associated with recent supernova explosions, as indicated by the presence of young pulsars (Neronov & Semikoz 2012). Those sources are thus potentially sites of recent injection of cosmic rays and are good candidates for the production of neutrinos.
According to our analysis, if the observed VHE emission is from purely hadronic origin and stays stable over at least five years, these sources should be detectable with a neutrino detector having similar performance to the IceCube detector, but sensitive in the TeV–PeV range to sources located in the southern hemisphere (see Table 2). Nevertheless, this assumption of lack of variability needs to be confirmed by a long-term monitoring experiment (such as HAWC Abeysekara et al. 2012 or MILAGRO).
4. Conclusions
We have investigated the detectability of the neutrino diffuse emission produced by cosmic ray interactions in the Galaxy through proton-proton interactions. Quantitative calculation of the spectrum of the neutrino signal from each direction along the Galactic plane were done based on the Fermi γ-ray data in the 100 GeV band. We find that a possible evidence of neutrino detection from the Cygnus region can be reached only after about 20 years of exposure. Our estimates also show that the diffuse neutrino emission form the outer part of the Galaxy visible to IceCube is too weak to be detected as a combination of unidentified neutrino sources within a generic point-source analysis technique. Nevertheless, for the Cygnus region we have found precise positions, imaging, and spectral characteristics (Table 1) that could be used to optimize the IceCube data analysis to facilitate the source detections. Unlike for sources located in the northern hemisphere, the detection of neutrino sources located in the southern hemisphere seems more favorable. In our analysis, we found several neutrino sources which should be detectable with a neutrino detector sensitive to sources located in the southern hemisphere within only a few years of exposure (Table 2).
Our results show that an IceCube-like detector located in the northern hemisphere could detect neutrino sources within a ~ 5 yr exposure time if they accelerate hadrons to high energies, which could lead to significant progress toward the identification of sources of Galactic cosmic rays.
It should be mentioned that the analysis presented here is based on a binned method both in space and energy, and that it assumed the 79-string effective areas of IceCube. However, IceCube data analysis is normally performed using a more sophisticated unbinned method, where the energy and spatial distribution of events is used in the likelihood maximization procedure to enhance the discovery potential.
We note that a different analysis of the IceCube data, sensitive to the shower events produced by electron neutrinos, tau neutrinos and neutral current interactions was presented at a conference (Kopper et al. 2013) and it has much larger effective area in the southern hemisphere. Nonetheless it has much poorer angular resolution (about 10–15 degrees). It is possible that a selection of events with higher effective area and including shower events will be sensitive to a possible signal from the Galactic plane (see, e.g., Neronov et al. 2013, for details).
Acknowledgments
We acknowledge support from the Swiss National Science Foundation (SNSF), Switzerland.
References
- Aartsen, M. G., Abbasi, R., et al. (IceCube Collaboration) 2013, ApJ, submitted [arXiv:1307.6669] [Google Scholar]
- Abbasi, R., Abdou, Y., Abu-Zayyad, T., et al. 2011, ApJ, 732, 18 [Google Scholar]
- Abbasi, R., Abdou, Y., Ackermann, M., et al. (IceCube Collaboration) 2013, ApJ, 763, 33 [NASA ADS] [CrossRef] [Google Scholar]
- Abdo, A. A., Allen, B., Berley, D., et al. 2007, ApJ, 658, L33 [Google Scholar]
- Abdo, A. A., Ackermann, M., Ajello, M., et al. 2009, ApJ, 700, 1059 [NASA ADS] [CrossRef] [Google Scholar]
- Abdo, A. A., Abeysekara, U., Allen, B. T., et al. 2012, ApJ, 753, 159 [Google Scholar]
- Abeysekara, A. U., Aguilar, J. A., Aguilar, S., et al. 2012, Astropart. Phys., 35, 641 [Google Scholar]
- Ackermann, M., Ajello, M., Allafort, A., et al. 2011, Science, 334, 1103 [NASA ADS] [CrossRef] [PubMed] [Google Scholar]
- Ackermann, M., Ajello, M., Atwood, W. B., et al. (Fermi/Lat Collaboration) 2012, ApJ, submitted [arXiv:1202.4039] [Google Scholar]
- Aguilar, J. A. 2013, Nucl. Phys. B Proc. Suppl., 237, 250 [NASA ADS] [CrossRef] [Google Scholar]
- Aharonian, F., 2004, Very-High Energy Cosmic Gamma Radiation (Singapore: World Scientific publishing) [Google Scholar]
- Aharonian, F., Akhperjanian, A. G., Bazer-Bachi, A. R., et al. 2005a, A&A, 437, L7 [NASA ADS] [CrossRef] [EDP Sciences] [Google Scholar]
- Aharonian, F. A., Akhperjanian, A. G., Bazer-Bachi, A. R., et al. 2005b, A&A, 442, L25 [NASA ADS] [CrossRef] [EDP Sciences] [Google Scholar]
- Aharonian, F., Akhperjanian, A. G., Aye, K.-M., et al. 2005c, Science, 307, 1938 [NASA ADS] [CrossRef] [PubMed] [Google Scholar]
- Aharonian, F., Akhperjanian, A. G., Bazer-Bachi, A. R., et al. 2006a, ApJ, 636, 777 [Google Scholar]
- Aharonian, F., Akhperjanian, A. G., Bazer-Bachi, A. R., et al. 2006b, Nature, 439, 695 [NASA ADS] [CrossRef] [PubMed] [Google Scholar]
- Aharonian, F., Akhperjanian, A. G., Barres de Almeida, U., et al. 2008, A&A, 477, 353 [Google Scholar]
- Anchordoqui, L., Halzen, F., Montaruli, T., & Murchadha, A. 2007, Phys. Rev. D, 76, 067301 [NASA ADS] [CrossRef] [Google Scholar]
- Aschenbach, B. 1998, Nature, 396, 141 [NASA ADS] [CrossRef] [Google Scholar]
- Aschenbach, B., Iyudin, A. F., & Schönfelder, V. 1999, A&A, 350, 997 [NASA ADS] [Google Scholar]
- Beacom, J. F., & Kistler, M. D. 2007, Phys. Rev. D, 75, 083001 [NASA ADS] [CrossRef] [Google Scholar]
- Berezinsky, V. S., Gaisser, T. K., Halzen, F., & Stanev, T. 1993, Astropart. Phys., 1, 281 [NASA ADS] [CrossRef] [Google Scholar]
- Bloemen, J. B. G. M., Caraveo, P. A., Hermsen, W., et al. 1984, A&A, 139, 37 [NASA ADS] [Google Scholar]
- de Jager, O. C., Funk, S., & Hinton, J. 2005, in 29th International Cosmic Ray Conference, eds. B. Snipathi Acharya, S. Gupta, et al., 4, 239 [Google Scholar]
- Dermer, C. D. 1986, A&A, 157, 223. [NASA ADS] [Google Scholar]
- Evoli, C., Grasso, D., & Maccione, L. 2007, J. Cosmology Astropart. Phys., 6, 3 [NASA ADS] [CrossRef] [Google Scholar]
- Fichtel, C. E., Hartman, R. C., Kniffen, D. A., et al. 1975, ApJ, 198, 163 [NASA ADS] [CrossRef] [Google Scholar]
- Funk, S., Hinton, J. A., Pühlhofer, G., et al. 2007, ApJ, 662, 517 [NASA ADS] [CrossRef] [Google Scholar]
- Halzen, F., Kappes, A., & Ó Murchadha, A. 2008, Phys. Rev. D, 78, 063004 [Google Scholar]
- Honda, M., Kajita, T., Kasahara, K., Midorikawa, S., & Sanuki, T. 2007, Phys. Rev. D, 75, 043006 [NASA ADS] [CrossRef] [Google Scholar]
- Hunter, S. D., Bertsch, D. L., Catelli, J. R., et al. 1997, ApJ, 481, 205 [NASA ADS] [CrossRef] [Google Scholar]
- Kappes, A., Hinton, J., Stegmann, C., & Aharonian, F. A. 2007, ApJ, 656, 870 [NASA ADS] [CrossRef] [Google Scholar]
- Kappes, A., Halzen, F., & Murchadha, A. Ó. 2009, Nucl. Instrum. Meth. Phys. Res. A, 602, 117 [NASA ADS] [CrossRef] [Google Scholar]
- Katagiri, H., Enomoto, R., Ksenofontov, L. T., et al. 2005, ApJ, 619, L163 [NASA ADS] [CrossRef] [Google Scholar]
- Kopper, C. (for the IceCube Collaboration) ICRC 2013, contribution 0650 [Google Scholar]
- KM3NeT, http://www.km3net.org/home.php [Google Scholar]
- Kraushaar, W. L., Clark, G. W., Garmire, G. P., et al. 1972, ApJ, 177, 341 [NASA ADS] [CrossRef] [Google Scholar]
- Learned, J. G., & Pakvasa, S. 1995, Astropart. Phys., 3, 267. [NASA ADS] [CrossRef] [Google Scholar]
- Lemiere, A., Slane, P., Gaensler, B. M., & Murray, S. 2009, ApJ, 706, 1269 [NASA ADS] [CrossRef] [Google Scholar]
- Neronov, A., & Ribordy, M. 2009, Phys. Rev. D, 80, 083008 [NASA ADS] [CrossRef] [Google Scholar]
- Neronov, A., & Semikoz, D. V. 2012, Phys. Rev. D, 85, 083008 [CrossRef] [Google Scholar]
- Neronov, A., Semikoz, D. V., & Tchernin, C. 2013 [arXiv:1307.2158] [Google Scholar]
- Kamae, T., Karlsson, N., Mizuno, T., Abe, T., & Koi, T. 2006, ApJ, 647, 692 [NASA ADS] [CrossRef] [Google Scholar]
- Kelner, S. R., Aharonian, F. A., & Bugayov, V. V. 2006, Phys. Rev. D, 74, 034018 [NASA ADS] [CrossRef] [Google Scholar]
- Malizia, A., Bassani, L., Di Cocco, G., et al. 2004, ATel, 227, 1 [Google Scholar]
- Manchester, R. N., & Taylor, J. H. 1981, AJ, 86, 1953 [NASA ADS] [CrossRef] [Google Scholar]
- Manchester, R. N., Bell, J. F., Camilo, F., et al. 2002, Neutron Stars in Supernova Remnants, eds. P.O. Slane, & B.M. Gaensler, ASP Conf. Ser., 271, 31 [Google Scholar]
- Paz Arribas, M., Schwanke, U., Sushch, I., et al. 2011, Proc. 32nd ICRC, 7, 140 [arXiv:1203.2532] [Google Scholar]
- Routledge, D., & Vaneldik, J. F. 1988, ApJ, 326, 751 [NASA ADS] [CrossRef] [Google Scholar]
- Slane, P., Castro, D., Funk, S., et al. 2010, ApJ, 720, 266 [NASA ADS] [CrossRef] [Google Scholar]
- Sugizaki, M., Mitsuda, K., Kaneda, H., et al. 2001, ApJS, 134, 77 [NASA ADS] [CrossRef] [Google Scholar]
- Stecker, F. W. 1979, ApJ, 228, 919 [NASA ADS] [CrossRef] [Google Scholar]
- Taylor, A., Gabici, S., White, R., Casanova, S., & Aharonian, F. 2008, AIP Conf. Ser., 1085, 384 [NASA ADS] [CrossRef] [Google Scholar]
- Tchernin, C., Aguilar, J. A., Neronov, A., & Montaruli, T. 2013, A&A, 555, A70 [NASA ADS] [CrossRef] [EDP Sciences] [Google Scholar]
- Tomsick, J. A., Lingenfelter, R., Walter, R., et al. 2003, IAU Circ., 8076, 1 [NASA ADS] [Google Scholar]
- Weinstein, A., et al. (VERITAS Collaboration) 2009, Fermi Symposium eConf Proceedings C091122 [arXiv:0912.4492] [Google Scholar]
- Weinstein, A., et al. (VERITAS Collaboration) 2011, Fermi Symposium eConf proceedings C110509 [arXiv:1111.1034] [Google Scholar]
- Whiteoak, J. B. Z., & Green, A. J. 1996, A&AS, 118, 329 [NASA ADS] [CrossRef] [EDP Sciences] [Google Scholar]
All Tables
Optimal positions and energy thresholds of the source signal regions for the search of neutrino emission from extended regions.
All Figures
|
Fig. 1 Profiles of the intensity (top) and the spectral index (bottom) of the γ-ray power-law emission in the energy band above 100 GeV. Fermi/LAT counts are collected from the circular regions of radius Ψ = 2° around each Galactic longitude of the Galactic plane. The fluxes are normalized on the flux from the Cygnus region at longitude l = 80°. The shaded region marks the part of the Galactic plane in the southern hemisphere. Vertical lines with the names show locations of bright extended VHE γ-ray sources. |
| In the text | |
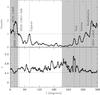 |
Fig. 2 Same as in Fig. 1, but for the source region radius Ψ = 4°. |
| In the text | |
|
Fig. 3 Fermi/LAT countmap of the Cygnus region in the energy band above 100 GeV, smoothed with a Gaussian kernel of 1 degree. The regions indicated by the green circles are used for the spectral extraction of Fermi/LAT data and have radii of 2 and 4 degrees (from small to large). Positions and names on known VHE γ-ray sources are marked. |
| In the text | |
|
Fig. 4 Data points: Fermi/LAT spectra of the 1, 2 and 4 degree regions in the Cygnus region (from bottom to top). Straight lines show fits to the spectra with extrapolations to higher energies. Curves represent the 90% confidence level. sensitivities of IceCube (2 yr exposure) for the extended sources of the size 1, 2 and 4 degree (from bottom to top) for all neutrino flavors, assuming that at Earth, after oscillations, the muonic neutrino flux is one third of the total neutrino flux (Learned & Pakvasa 1995). The horizontal hatched region shows the spectrum of the VHE γ-ray source MGRO J2019+37. The vertical hatched region shows the spectrum of MGRO J2031+41. The gray shading shows the sum of the fluxes of MGRO J2019+37 and MGRO J2031+41 (Abdo et al. 2012); both sources are within the 4 degree source region considered for spectral extraction in Fermi/LAT. |
| In the text | |
|
Fig. 5 Strength of the γ-ray (and hence neutrino) signal within circles of radius Ψ = 2° at different locations inside the Cygnus region. Each pixel shows the position of the center of the circle. The color scale shows the number of γ-ray counts in the circles. |
| In the text | |
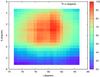 |
Fig. 6 Same as in Fig. 5, but for Ψ = 4°. |
| In the text | |
|
Fig. 7 Poissonian probability that the neutrino signal expected from the γ-ray observations are due to the fluctuations of the atmospheric neutrino background for 10 years exposure time with IceCube in the IC-79 configuration and a 2 degree region of interest around each longitude of the galactic plane (l), for the northern hemisphere (l ∈ [34:220] °). A line corresponding to the probability of 3σ has been added to help the readability. Key: in black, the probability using the spectral index computed with the Eq. (2); in grey, the uncertainties of the probability corresponding to 1σ. |
| In the text | |
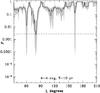 |
Fig. 8 Same as in Fig. 7, but for a 4 degree region of interest. |
| In the text | |
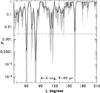 |
Fig. 9 Same as in Fig. 7, but for a 20 year exposure. |
| In the text | |
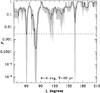 |
Fig. 10 Same as in Fig. 9, but for a 4 degree region of interest. |
| In the text | |
|
Fig. 11 Same as in Fig. 7, but for a hypothetical northern IceCube detector situated at the north pole and sensitive for the sources in the southern hemisphere. For five years of exposure. |
| In the text | |
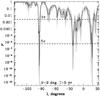 |
Fig. 12 Same as in Fig. 11, but for a 4 degree region of interest around each galactic longitude. |
| In the text | |
Current usage metrics show cumulative count of Article Views (full-text article views including HTML views, PDF and ePub downloads, according to the available data) and Abstracts Views on Vision4Press platform.
Data correspond to usage on the plateform after 2015. The current usage metrics is available 48-96 hours after online publication and is updated daily on week days.
Initial download of the metrics may take a while.