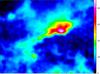
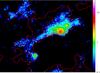
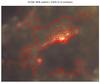
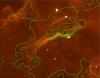
Fig. 11
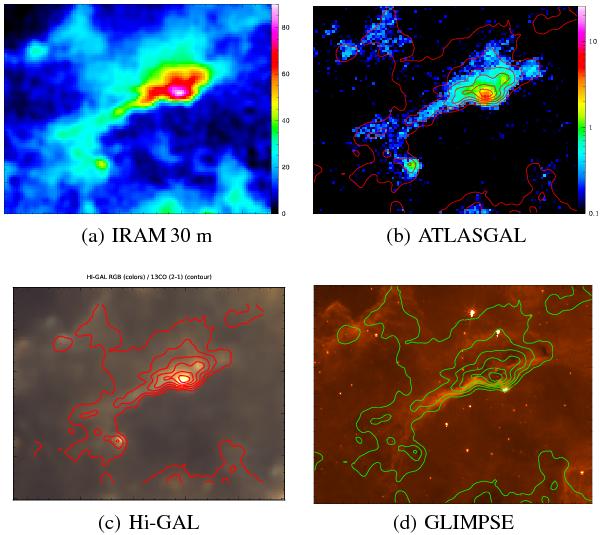
Series of plots showing the comparison of different datasets of source 23 (see Table 1). From upper left to lower right: a) IRAM 30 m integrated intensity map of 13CO (2–1), b) IRAM 30 m 13CO map contours on ATLASGAL 870 μm map, c) IRAM 30 m 13CO map contours on Hi-GAL RGB map composed of the 350, 250 and 160 μm maps, and d) IRAM 30 m 13CO map contours on GLIMPSE 8 μm map
Current usage metrics show cumulative count of Article Views (full-text article views including HTML views, PDF and ePub downloads, according to the available data) and Abstracts Views on Vision4Press platform.
Data correspond to usage on the plateform after 2015. The current usage metrics is available 48-96 hours after online publication and is updated daily on week days.
Initial download of the metrics may take a while.