| Issue |
A&A
Volume 560, December 2013
|
|
|---|---|---|
| Article Number | A59 | |
| Number of page(s) | 10 | |
| Section | Extragalactic astronomy | |
| DOI | https://doi.org/10.1051/0004-6361/201321588 | |
| Published online | 05 December 2013 | |
Density waves and star formation in grand-design spirals
1 Instituto de Astrofísica de Canarias (IAC), 38200 La Laguna, Tenerife, Spain
e-mail: bce@iac.es
2 Departamento de Astrofísica, Universidad de La Laguna (ULL), 38205 La Laguna, Tenerife, Spain
3 Departamento de Física, Escuela Superior de Física y Matemáticas, IPN, México D.F., México
4 Herschel Science Centre, INSA/ESAC, PO Box 78, 28691 Villanueva de la Cañada, Madrid, Spain
5 Faculty of Education, Wakayama University, 640-8510 Wakayama, Japan
Received: 27 March 2013
Accepted: 14 October 2013
Context. H II regions in the arms of spiral galaxies are indicators of recent star-forming processes. They may have been caused by the passage of the density wave or simply been created by other means near the arms. The study of these regions may give us clues to clarify the controversy about the existence of a triggering scenario, as proposed in the density-wave theory.
Aims. If the passage of the density wave contributes significantly to the formation of H II regions in the arms of grand-design spirals, we can find a relationship in their position relative to the arms.
Methods. Using Hα direct imaging, we characterize the H II regions from a sample of three grand-design galaxies: NGC 5457, NGC 628, and NGC 6946. Broad-band images in R and I were used to determine the position of the arms. The H II regions found to be associated with arms were selected for the study. The age and star formation rate of these H II regions was obtained using measurements on the Hα line. The distance between the current position of the selected H II regions and the position they would have if they had been created in the centre of the arm was calculated. A parameter, T, which measures whether a region was created in the arm or in the disc, was defined.
Results. With the help of the T parameter we determine that the majority of regions were formed some time after the passage of the density wave, and the regions are located behind the zone they should have occupied (in the direction of the rotation of the galaxy) had they been formed in the centre of the arm. Moreover, the relative efficiency of the star formation rate between arm and interarm was calculated for all the galaxies.
Conclusions. The large number of regions created after the passage of the arm may be explained by the effect of the density wave, which helps to create the star-forming regions after its passage. There is clear evidence of triggering for NGC 5457 and a co-rotation radius is proposed. A more modest triggering seems to exist for NGC 628, and insignificant evidence of triggering is found for NGC 6946.
Key words: galaxies: spiral / H II regions / galaxies: star formation / galaxies: star clusters: general / galaxies: structure
© ESO, 2013
1. Introduction
The density-wave theory was established by the pioneering work of Lin & Shu (1964, 1966) to explain the spiral structure present in many galaxies, even though there has been a controversy with other mechanisms that have been proposed to explain the formation of the spiral arm (see, for example, Sellwood 2011 and references therein; Wada et al. 2011). Another controversy exists about whether the density wave is able to trigger star formation, as originally proposed by Roberts (1969), or whether it is just a means of reorganizing the material and the star-forming regions generated by other processes, such as the stochastic self-propagating star formation method proposed by Gerola & Seiden (1978), which is much more prone to generating more fragmented, multiple arms.
Parameters of the galaxy sample.
Indeed, there exists clear evidence for the triggering of star formation in the arms of grand-design galaxies. Cepa & Beckman (1990) found that the star formation efficiency was higher in the arms that in the interarm regions of the galaxies NGC 3922 and NGC 628. Similar results were obtained by Knapen et al. (1996) for NGC 4321 and by Lord & Young (1990) for M 51. Seigar & James (2002) found an increase in the Hα flux near the K-band arms for a sample of 20 spiral galaxies, and they interpreted this as star formation triggering by the density wave. Cedrés et al. (2005), using Monte Carlo simulations, found that there was a trend for the star-forming regions in a grand-design galaxy to have an initial mass function (IMF) biased towards a higher fraction of massive stars than the regions of a flocculent one. More recently, Grosbøl & Dottori (2009), using K-band images for the spiral galaxy NGC 2997, found that there was a trigger of star formation via the compression of the gas for the most massive regions, while smaller star-forming regions are formed more randomly across the rest of the disc.
On the other hand, the evidence for a non-triggering scenario is also compelling. Elmegreen & Elmegreen (1984) found no evidence for triggering in a sample of 34 spiral galaxies when comparing the blueness of the arm with the interarm regions in the grand design-galaxies. Elmegreen & Elmegreen (1986), employing Hα and UV bands, also found that the star formation rate (SFR) was independent of the presence of the density wave for a sample of galaxies. Dobbs & Pringle (2009), using a model of the interstellar medium and an estimate of the SFR based on the mass of gas in bound clumps, found no evidence of a dependence of the SFR on the strength of the spiral shock. Recently, Foyle et al. (2010), using a multiband analysis from H I to the far-UV for the grand design galaxies NGC 5194, NGC 682, and NGC 6946, found that there is no shock trigger, and that the spiral arms just reorganize the material from the disc, which will generate stars as a function of gas density, following a Kennicutt-Schmidt law, for example (Kennicutt 1998a).
With this study, we aim to determine whether the H II regions associated by proximity with the arms of different grand design-galaxies were formed by the influence of the density wave or are just associated with a higher density in the arm, and whether or not a triggering scenario exists. In Sect. 2 we describe the selected galaxies and the data. In Sect. 3 we present the method and examine the dependence of the SFR on the position of the H II region with respect to the arms. In Sect. 4 we discuss the possible presence of triggering in the galaxies of the sample, and in Sect. 5 a summary is given.
2. Data
We selected three grand-design galaxies with a low inclination (to better identify the spiral arms) that are located relatively close to us to be able to gather data from a large number of H II regions with good spatial resolution. To be able to trace the spiral arms more easily the galaxies had to be of grand-design type. The selected galaxies were NGC 628 (M74), NGC 5457 (M101), and NGC 6946. All three galaxies are arm class 9 according to Elmegreen & Elmegreen (1987).
For NGC 5457 we took the data from Cedrés & Cepa (2002). Their catalogue contains data for 338 H II regions in several emission lines, including the fluxes in Hα, information about the Hα equivalent width, the size of the regions, and the extinction. For galaxies NGC 628 and NGC 6946 we employed data obtained through narrow-band filter imaging from the Nordic Optical Telescope (NOT) with the ALFOSC instrument. These data, together with the reduction and calibration processes and a study of oxygen abundance, are presented in Cedrés et al. (2012).
For this study only the fluxes for Hα line, the Hα equivalent width, and the size of the H II regions are necessary. In Table 1 we summarize the main parameters of the galaxies.
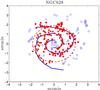 |
Fig. 1 Position of the H II regions detected in galaxy NGC 628. Filled circles are the regions considered to belong to the NSN arm, while the filled squares mark the regions considered to belong to the SNS arm. The dashed line represents the position of the co-rotation. North is at the top and east is left. |
3. H II region parameters
3.1. Arm characterization and selection
The arms of the galaxies of the sample were defined using images in the I band obtained from the literature (Knapen et al. 2004). The width of the arms for each galaxy was calculated as follows: the I-band image was smoothed using a median filter to wipe out the high spatial frequency variations in the flux of the disc and the arms of the galaxy. This filter was square with a size of 10 × 10 pixels (approximately twice the mean seeing value). Several radial profiles were generated, from the centre of the galaxy (but avoiding the nucleus) that intersected the arms. The contribution from the disc was removed by fitting an exponential to the brightness profile of the galaxy (Freeman 1970), and then this exponential was subtracted from the data. Gaussians were fitted to the residuals in the places where the arms were intersected. We can therefore assume that the FWHM of the fitted Gaussians is the width of the arms. For NGC 628 and NGC 5457 the median value of the width is 0.5 arcmin. For NGC 6946 it is 0.54 arcmin.
The arm positions were traced by determining the maximum-emission point in boxes large enough to contain the full width of the arm in the zone, but small enough to be unaffected by the other arms, stars, and/or bright H II regions. The typical size of the boxes was about 0.7′ × 0.7′, which is equivalent to 1.5 × 1.5 kpc2 for NGC 5457 and NGC 628, and 1.1 × 1.1 kpc2 for NGC 6946.
The regions were associated with each arm using a proximity criterion: they were assumed to belong to the arm they were closer to when they were inside (totally or partially) the width of the arm, and there were no uncertainties concerning their association to a satellite arm or any other kind of structure not directly related to the main arm. Following this criterion, nuclear or circumnuclear regions were not considered either. For NGC 628 only the two main arms were included in the study (Fig. 1). The complex structure of NGC 5457, with several discontinuous satellite arms, makes it feasible to study only the NSN arm. In Fig. 2 the inner parts of this galaxy with the H II regions detected by Cedrés & Cepa (2002) and the positions of the central part of the arms are indicated. Four arms were considered for NGC 6946, as indicated in Fig. 3.
In Table 2 a summary of the arms employed for each galaxy and the number of regions associated with each arm is presented.
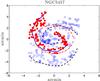 |
Fig. 2 Position of H II regions and the arms in galaxy NGC 5457 from Cedrés & Cepa (2002). Filled circles are the regions selected for this study and that possibly belong to the arm marked with the continuous line. The dashed lines represent the other arms detected for this galaxy. The dot-dashed line represent the possible location of the co-rotation radius (see Sect. 4.2). North is at the top and east is left. |
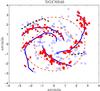 |
Fig. 3 Position of the H II regions detected in galaxy NGC 6946. Filled circles are the regions considered for the main north arm. Filled squares, filled diamonds, and filled triangles are the regions considered for the NS arm, the south arm, and the SN arm. Two secondary satellite arms, not included in the study, are represented by the dashed lines. The inner dot-dashed line is the Ω − κ/3 resonance, and the outer dot-dashed line is the Ω − κ/4 resonance. North is at the top and east is left. |
Number of regions in each of the arms selected for the galaxies in the sample.
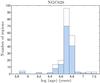 |
Fig. 4 Age histogram for NGC 628. The white bars represent the whole sample of H II regions for this galaxy. The shaded bars are the regions selected for the study in the arms, as indicated in Fig. 1. |
3.2. Age determination
The age of the H II regions of the galaxies was obtained using the Hα equivalent width through the Leitherer et al. (1999) models. These models present three different IMFs: a Salpeter function (1955) with a slope of − 2.35 and an upper mass of 100 M⊙, a truncated Salpeter with an upper mass of 30 M⊙, and an IMF with a slope of − 3.30 and an upper mass of 100 M⊙. The variation of the derived ages due to the use of different IMFs is lower than 3% in most cases, which is lower than the uncertainties introduced by the errors in the equivalent width that dominate the age determination of the regions. Therefore, we assumed a Salpeter (1955) IMF as the most probable one for our H II regions. We also assumed an instantaneous burst for the SFR. Five metallicities are available from the Leitherer et al. (1999) models: Z = 0.040, 0.020 (Z⊙), 0.008, 0.004, and 0.001, where Z = Z⊙ × 10(log (O/H) − 12 + 3.1). From Table 1, the abundances without considering the gradients are between Z ≃ 0.008 and Z = Z⊙. However, as with the determination of the IMF, the uncertainties derived from the use of different abundances are much smaller than the uncertainties that introduce the errors in the equivalent widths, therefore the results in the age determination of the regions are almost independent of the metallicity range in which the H II regions are located. For this reason we selected only the metallicity Z = Z⊙ = 0.020. For the regions with equivalent widths larger that the highest value tabulated for the model, a minimum age of log (age) = 5.9 (with the age expressed in years) was assigned. In Figs. 4–6 the age histograms for all the detected regions of NGC 628, NGC 5457, and NGC 6946 are represented (the regions selected for this study are marked by the shaded bars). In Figs. 7–9 the age maps for NGC 628, NGC 5457 and NGC 6946 are represented in the same order.
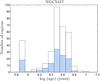 |
Fig. 5 Age histogram for NGC 5457. The white bars represent the whole sample of H II regions for this galaxy. The shaded bars are the regions selected for the study in the arm, as indicated in Fig. 2. |
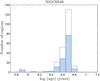 |
Fig. 6 Age histogram for NGC 6946. The white bars represent the whole sample of H II regions for this galaxy. The shaded bars are the regions selected for the study in the arms, as indicated in Fig. 3. |
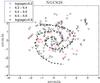 |
Fig. 7 Age map for the H II regions of NGC 628. The meaning of the different symbols is as indicated. |
Median ages of all the H II regions of the galaxies used in this study.
Table 3 shows the median value of the age distribution obtained from all the H II regions of the galaxies and is represented by the histograms in Figs. 4 to 6. From this table and Figs. 4 to 9, even though apparently that the H II regions of NGC 5457 are, in general terms, ≃2 Myr younger than the regions from NGC 628 and ≃1.6 Myr younger than the regions from NGC 6946, the high value of the data dispersion does not allow us to conclude that this age difference is significant. However, this result for NGC 5457 agrees well with those determined by Egusa et al. (2009), and our general results for NGC 628 are in the same range as those obtained in Sánchez-Gil et al. (2011), who used a different method for determining the age of the star-forming regions (Hα to far-UV flux ratio).
3.3. Definition of the T parameter
Assuming that a H II region of age ti was formed in the centre of the arm, its hypothetical position can be expressed in polar coordinates on the plane of the galaxy disc as (θi,Ri), where θi is the angle of the region (measured counterclockwise) and Ri is its galactocentric radius. These coordinates were obtained from the observed one (i.e. measured over the tangent plane of the sky) by de-projection with respect to the line of sight using the data in Table 1. In the same way, we can describe the observed position of the arm where this region was supposedly formed by the coordinates (θA, RA), where θA is the angle of the centre of the arm and RA its radius. Taking into account that the radial velocities of the H II regions are an order of magnitude lower than the circular velocities of the star-forming regions in the density wave model (Roberts 1969; Kuno & Nakai 1997), we may assume that the H II region has suffered no significant net movements, so that Ri = RA. In Fig. 10 we show a schematic drawing of a clockwise rotating arm where the position of the angles are indicated.
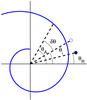 |
Fig. 10 Explanation of the deduction of the offset between the hypothetical position of a H II region formed in the centre of the arm and its real position for a clockwise-rotating galaxy. The trailing spiral arm is represented by the thick line. The hypothetical H II region is represented by the open circle. The real position of the H II region is indicated by the filled circle. The angles θi, θR, θA, and the offset δθ (between the arm and the theoretical position of the H II region) are indicated by an arc and the appropriated label. In this diagram it is assumed that the H II region is inside the co-rotation radius of the galaxy. |
Following Egusa et al. (2009), the angular offset between this hypothetical H II region and the centre of the arm can be expressed as 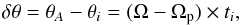 (1)where Ω is the rotation velocity of the galaxy at this radius and Ωp is the pattern speed associated to the density wave (see Table 1 for the rotation curves and the Ωp employed in this study). We can consider now the real position of a H II region, which is described by the coordinates (θR,RR). Again, if we assume that the region has suffered no radial displacements, then RR = RA = Ri. The offset between the position of a real H II region and the hypothetical one can be expressed as
 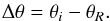 (2)This can be rearranged as (see Fig. 10)
 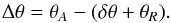 (3)Accordingly, Δθ gives us an indication of how far a H II region is located from its expected angular position if it had been formed in the centre of the arm. If the angles are measured in the direction of the disc rotation, the value of Δθ is positive when the region is ahead of its hypothetical position and negative when it is behind. This result does not depend on whether the H II region is located inside or outside the co-rotation radius.
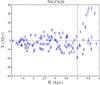 |
Fig. 11 Parameter T (Eq. (4)) as a function of galactocentric distance for the sample of selected H II regions (arm regions) of NGC 628. |
However, two regions with the same Δθ would have different linear distances to the arm depending on the radial position of the region, therefore Δθ is not a good parameter to quantify the distance to the density wave. Moreover, the linear distance obtained with Δθ will also be dependent on the radius through the differential rotation of the galaxy disc, accordingly to compare regions at different radii are used the following parameter: 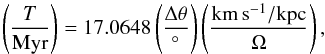 (4)where T is the time required for the region to cross the Δθ angle. This parameter is independent of the position of the region in the galaxy. A positive value of T (or Δθ) means that the distance from the centre of the arm to the position of the H II region (θA − θR) could not have been travelled by this region in is lifetime; therefore, the region was not formed in the centre of the arm, but before the passage of the arm across the molecular cloud in which the H II region will form (the previously defined ahead position). Vice versa, a negative value of T (or Δθ) means that the region was formed after the passage of the arm (the behind position).
In Figs. 11–13 we represent the parameter T as a function of galactocentric distance for the galaxies in the sample. The error bars in these figures were obtained through the error propagation in the equations from the errors in the age of the H II regions and the error in the determination of the pattern speed, and assuming an uncertainty in the position of the H II regions equal to the mean seeing of the images. The regions closer to T = 0 were consequently probably formed by the arm, and those farther away were just associated with the arm, but formed in the interarm disc, either before or behind the centre of the arm. This effect is clearer for NGC 628 and NGC 5457 (Figs. 11 and 12, respectively), where a small group of regions appears with T < − 20 Myr, which are probably formed in the disc before the arm.
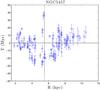 |
Fig. 12 Parameter T (Eq. (4)) as a function of galactocentric distance for the sample of selected H II regions (arm regions) of NGC 5457. |
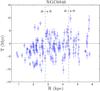 |
Fig. 13 Parameter T (Eq. (4)) as a function of galactocentric distance for the sample of selected H II regions (arm regions) of NGC 6946. |
It is also apparent that there are more regions with a negative value for T than with a positive value: 79% of the regions for NGC 638, 57% of the regions for NGC 5457, and 69% of the regions for NGC 6946. Taking into account the uncertainties in determining T, it is possible that the excess of regions with T < 0 is due to a pure random effect of the errors in the different parameters and is not a significant behavior of the H II regions. With this hypothesis, the real median value of the T parameter is expected to be approximately equal to zero. Taking into account that the T distributions are not normal, we cannot accurately use a statistical test to state the statistical significance of the regions with negative values of T. Therefore, to check this possible effect, we randomly altered the value of T of each region inside three times its error (we assumed that the uncertainties in T have a Gaussian behaviour and three times are equivalent to the 99% confidence level). We repeated this experiment 10 000 times and calculated the median value of T for each time. The results are presented in Fig. 14. For all the tests, the median value of T is always negative, consequently we conclude that the presence of a majority of H II regions with T < 0 are due the nature of the regions and is not an effect of the uncertainties in the data.
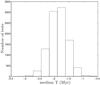 |
Fig. 14 Histogram with the median values of the parameter T for 1000 tests for the three galaxies. In each test, the nominal value of the T parameter for each region was varied a random value 3 times its respective error. |
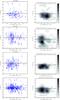 |
Fig. 15 Parameter T as a function of the logarithm of the SFR for the H II regions in our sample (left panels) and the contour plot of the same quantities obtained with bins of 0.4 in log (SFR) and of 7.7 in T (right panels). The data from the regions of NGC 628, NGC 5457, and NGC 6946 are represented in the uppermost, second and third panels, respectively. The whole sample of H II regions selected in this study is represented in the lowermost panel. In the right panels, the number of regions per bin is indicated by the colour bars. |
3.4. Star formation rate
From Figs. 11 to 13 it is clear that there are regions where the star formation started around the moment of the passage of the density wave, some just before and some just after, and regions that were associated with the density wave, since one of the selection criteria for the H II regions was their spatial relation with the spiral arm; but this was probably initiated by another event outside the spiral arms, as we discuss below.
To explore whether the star formation is really triggered by the arms, it is necessary to obtain the SFR of the H II regions. To this aim, we used the expression derived by Kennicutt (1998b) with the same assumptions we employed so far: solar abundance and a Salpeter IMF: 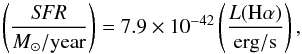 (5)assuming case B for recombination, an electron temperature of 10 000 K, and no photon leakage.
In Fig. 15 we present the T parameter as a function of log (SFR) for each galaxy separately and for the total number of H II regions selected for the three galaxies (left panels). There seems to be no correlation between T and the SFR. However, it is clear that a tendency exists for the H II regions to be located at T < 0. To see this effect more clearly, we present in the right panels of Fig. 15 the contours of the number of regions in bins of 0.4 in log (SFR) and 7.7 Myr in T (this divides the log (SFR) − T space into a 10 × 10 reticule and the values for the bins are about three times higher than the mean error for each variable). The zone with the largest number of regions is always below the T = 0 line. For NGC 5457 (second panel from the top), the distribution seems more complex than that of the rest, with two lobes, one for positive values of T and one (more prominent) for negative values of T. For NGC 628 (uppermost panel) and NGC 6946 (third panel from the top), the behaviour is more regular, with the maximum in the − 10 < T < 0 zone. In the contour plot of the total number of regions (lowermost right panel), the bulk of H II regions are located in a position that is behind (in the direction of the rotation of the galaxy) when compared with the theoretical position they would have if they had been formed in the centre of the arms. This may indicate that the star-forming processes occur some time after the passage of the density wave (indicated by the stellar arm) across the molecular clouds.
In Fig. 16 the integrated SFR versus parameter T is represented. The SFR was integrated in bins of 2 Myr width. The highest SFR is concentrated just after the passage of the central part of the arm and there is a large decrease in the SFR value (about 80%) just for the regions at T = 0. The peaks in the deta distribution are below the line at T = 0, which could indicate that not only were those regions triggered by the arm, but they were also created after the passage of the density wave. This, together with the distribution of the regions presented in Fig. 15, seems to agree with the scenario proposed by Roberts (1969), in which star formation occurs after the passage of the density wave. To confirm this behaviour, more observations of different galaxies with different arm classes are required.
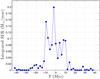 |
Fig. 16 Integrated SFR in bins of 2 Myr versus the T parameter for all the H II regions in the sample. |
4. Evidence for triggering of star formation
Even taking into account that there is a percentage of H II regions formed just after the passage of the density wave, we have yet to find clear evidence for the triggering of star formation. We considered that triggering occurred when the SFR in the arm is much higher than the SFR value in the interarm times the density ratio between both zones (Cepa & Beckman 1990). In an analogous method to that proposed by Cepa & Beckman (1990), we defined a relative arm efficiency of massive star formation (ϵ). This relative arm efficiency can be described as the ratio of the SFR per area unit between the arm and interarm regions at the same radial distances divided by the amplitude of the arm measured in I-band images. This amplitude is defined as the ratio of the I flux in arbitrary units per area unit between the arm and interarm at similar angular and radial distances (Elmegreen & Elmegreen 1984), and can be considered a lower boundary of the density wave amplitude, since the amplitude of the stellar density wave is lower than that of the gas (Elmegreen & Elmegreen 1985; Elmegreen et al. 1992). We applied this in radial bins of 1 kpc for galaxies NGC 628 and NGC 5457, and of 0.5 kpc for NGC 6946 (because this galaxy is closer to us than the other two, see Table 1). Therefore, the efficiency at radius R is 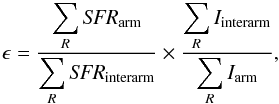 (6)where SFRarm and SFRinterarm are the SFR of a H II region at a radius R per area unit in the arm or in the interarm, respectively, and Iarm and Iinterarm are the I fluxes per area unit in arbitrary units at the same radius of the H II region. We summed across all the regions inside the bin whose mean radius is R. This dimensionless factor takes into account the difference in density between arm and interarm zones, which makes it a good indicator of the triggering of the star formation. Indeed, if ϵ is of the order of unity, there is no triggering, and if ϵ is much larger than one, a star formation triggering occurs at the selected radius (Cepa & Beckman 1990).
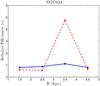 |
Fig. 17 Relative arm and interarm star formation efficiency for NGC 628 versus the deprojected galactocentric radius in bins of 1 kpc width. The filled circles and continuous line represent the data from the NSN arm, filled squares and dashed line represent the data from the SNS arm. |
To obtain the values of ϵ we calculated the SFR for the interarm regions. However, our selection criterion is based on selecting only the regions closer to the arms, so the possibility of a lack of interarm regions exists. For this reason, in this case we considered all the regions with |Δθ| < 100° for NGC 628 and NGC 5457, and |Δθ| < 75° for NGC 6946 (with Δθ defined by Eq. (3)) as interarm regions. With these figures we included all the closer interarm regions and we minimized the inclusion of H II regions from other arms. Owing to the large number of arms and satellite arms of NGC 6946 compared with the other two galaxies in the sample, the highest value selected for |Δθ| is lower than the one employed for NGC 628 and NGC 5457 (see Figs. 1 to 3).
In Fig. 17 we present the relative efficiency as a function of the deprojected galactocentric radius for the two arms of NGC 628. For both arms, the efficiency is very low (on the order of unity) along the entire length of the radius. However, for the SNS arm, there is a relative strong increase in the efficiency in the bin with the centre at 3.5 kpc, indicating a possible triggering of star formation. This triggering is only of massive star formation, since Hα is sensitive to ionizing stars, and the IMF might be biased in the arms in the sense of a larger portion of massive stars in the arms than in the interarm regions (Cedrés et al. 2005). Cepa & Beckman (1990) also found triggering, but closer to the centre of the galaxy (at about 2 kpc). Nevertheless, it has to be taken into account that in the method of calculating the relative efficiency by Cepa & Beckman (1990), the distance employed and the inclination angle are entirely different from those used in this study.
In Fig. 18 we presente the relative efficiency as a function of the deprojected galactocentric radius for NGC 5457. This galaxy presents two noteworthy peaks at bins centred at R = 4.5 kpc and R = 6.5 kpc. The first one indicates a strong episode of triggering of star formation activity in the arm compared with the interarm. Another remarkable feature for this galaxy is the ϵ = 0 at R = 5.5 kpc.
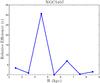 |
Fig. 18 Relative arm and interarm star formation efficiency for NGC 5457 versus the deprojected galactocentric radius in bins of 1 kpc width. |
To study this complete lack of efficiency, in Fig. 19 we present the value of Δθ for all the regions detected in the galaxy versus galactocentric radius. The two curves represent the limits of the arm. There is an apparent lack of H II regions formed in the arm from 4.75 kpc to 6 kpc. The vertical line marks the radius where the measured relative efficiency is 0 in Fig. 18. Moreover, we observe in Fig. 11 the lack of H II regions between 5 to 6 kpc. This lack of regions formed by the passage of the density wave may indicate the presence of the co-rotation radius here, an effect previously suggested in Cepa & Beckman (1990). Indeed, Egusa et al. (2009) reporteda range from 2 kpc to 6.7 kpc in radius for the position of the co-rotation, which is compatible with this result. This radius is indicated in Fig. 2 with the dot-dashed line. Moreover, as noted in del Río & Cepa (1998), the bifurcation of the arm at about this radius increases the probability that there is co-rotation near this location. However, this galaxy may have several pattern speeds, (see, for example Meidt et al. 2009), therefore it is possible that between the co-rotation of the inner disc pattern overlaps with some resonance for one of the outer patterns (according to Meidt et al. 2009, this could be Ω − κ/2 for a pattern of Ω = 18 km s-1 kpc-1), which may explain the lack of regions in this arm at the galactocentric radius.
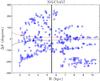 |
Fig. 19 Angular distance Δθ as obtained in Eq. (3) versus the deprojected galactocentric radius for all the regions in NGC 5457. The vertical line indicates the suggested position for the co-rotation radius. The other two curves indicate the angular limits of the arm. |
In Fig. 20 the relative efficiency as a function of the deprojected radius for NGC 6946 is shown. Star formation triggering apparently does not exist for the arms of this galaxy, but just a small increase for one of the arms at R = 2 kpc. This is expected, because a) there is a lack of interarm H II regions; and b) even though this galaxy is classified as class 9 according to Elmegreen & Elmegreen (1987), it presents a more chaotic structure of the arms than NGC 628 and NGC 5457, and it can be considered as more flocculent than the other galaxies of the sample (Foyle et al. 2010). Fathi et al. (2007) situate the co-rotation radius for this galaxy at 8.3 kpc.
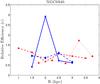 |
Fig. 20 Relative arm and interarm star formation efficiency for NGC 6946 versus the deprojected galactocentric radius in bins of 0.5 kpc width. Symbols as in Fig. 3. |
5. Conclusions
We have selected H II regions and associated them by proximity with several spiral arms of the grand-design galaxies NGC 628, NGC 5457 and NGC 6946. For these regions we were able to obtain their ages from the Hα equivalent width, employing the Leitherer et al. (1999) models, assuming a Salpeter IMF, and solar abundance.
Using the method described in Egusa et al. (2009), we calculated the positions in the disc that the arm H II regions should have if they had been formed at the maximum of the density wave. These theoretical positions were compared with the real positions through a new parameter, T, defined as the time required for a H II region to cross the offset between its real position and the position of a hypothetical region formed in the centre of the arm. This parameter is independent of the radius of the galaxy.
We calculated the SFRs for the selected H II regions and we presented them as a function of the T parameter. We found a concentration of H II regions in − 10 < T < 0. Moreover, the bulk of the integrated SFR is also in the − 10 < T < 0 range, in agreement with Roberts (1969), who suggested that star formation is taking place after the passage of the density wave.
The relative efficiency of the SFR between arm and interarm zones as a function of the galactocentric radius was calculated. Evidence of considerable triggering of star formation was found for NGC 5457, and a possible position for the co-rotation radius was suggested to be at about R = 5.5 kpc, where there is a lack of star formation regions. However, the spiral structure of NGC 5457 is very complex and this lack of H II regions and low star formation efficiency in the zone may be due overlapping multiple-pattern speeds that may exist for this galaxy. A more modest evidence of triggering was found for NGC 628 for one of the arms. The wide range of uncertainties for the position of the co-rotation given by Egusa et al. (2009) makes it difficult to reach a firm conclusion concerning the low efficiency at R = 2.5 kpc, just before the weak triggering at 3.5 kpc. The results seem to suggest an absence of triggering of star formation for NGC 6946. However, it should be noted that this galaxy is more flocculent than the other two. On the other hand, NGC 6946 presents a clear lack of H II regions not generated in the arms that may introduce a bias in the efficiency calculation.
Acknowledgments
This work was supported by the Spanish Ministry of Economy and Competitiveness (MINECO) under grants AYA2011-29517-C03-01 and AYA2010-08896-E. It is also a pleasure to thank the anonymous referee for very constructive comments and suggestions that helped to greatly improve the paper.
References
- Cepa, J., & Beckman, J. E. 1990, ApJ, 349, 497 [NASA ADS] [CrossRef] [Google Scholar]
- Cedrés, B., & Cepa, J. 2002, A&A, 391, 809 [NASA ADS] [CrossRef] [EDP Sciences] [Google Scholar]
- Cedrés, B., Urbaneja, M. A., & Cepa, J. 2004, A&A, 422, 511 [NASA ADS] [CrossRef] [EDP Sciences] [Google Scholar]
- Cedrés, B., Cepa, J., & Tomita, A. 2005, ApJ, 634, 1043 [NASA ADS] [CrossRef] [Google Scholar]
- Cedrés, B., Cepa, J., Bongiovanni, A., Castañeda, H., & Tomita, A. 2012, A&A, 545, A43 [NASA ADS] [CrossRef] [EDP Sciences] [Google Scholar]
- del Río, M. S., & Cepa, J. 1998, A&A, 340, 1 [NASA ADS] [Google Scholar]
- Dobbs, C. L., & Pringle, J. E. 2009, MNRAS, 396, 1579 [NASA ADS] [CrossRef] [Google Scholar]
- Egusa, F., Kohno, K., Sofue, Y., Nakanishi, H., & Komugi, S. 2009, ApJ, 697, 1870 [NASA ADS] [CrossRef] [Google Scholar]
- Elmegreen, B. G., & Elmegreen, D. M. 1985, ApJ, 288, 438 [NASA ADS] [CrossRef] [Google Scholar]
- Elmegreen, B. G., & Elmegreen, D. M. 1986, ApJ, 311, 554 [NASA ADS] [CrossRef] [Google Scholar]
- Elmegreen, D. M., & Elmegreen, B. G. 1984, ApJS, 54, 127 [NASA ADS] [CrossRef] [Google Scholar]
- Elmegreen, D. M., & Elmegreen, B. G. 1987, ApJ, 314, 3 [NASA ADS] [CrossRef] [Google Scholar]
- Elmegreen, B. G., Elmegreen, D. M., & Montenegro, L. 1992, 79, 37 [Google Scholar]
- Fathi, K., Toonen, S., Falcón-Barroso, J., et al. 2007, ApJ, 667, L137 [NASA ADS] [CrossRef] [Google Scholar]
- Foyle, K., Rix, H.-W., Walter, F., & Leroy, A. K. 2010, ApJ, 725, 534 [NASA ADS] [CrossRef] [Google Scholar]
- Freeman, K. C. 1970, ApJ, 160, 811 [NASA ADS] [CrossRef] [Google Scholar]
- Gerola, H., & Seiden, P. E. 1978, ApJ, 223, 129 [NASA ADS] [CrossRef] [Google Scholar]
- Grosbøl, P., & Dottori, H. 2009, A&A, 499, L21 [NASA ADS] [CrossRef] [EDP Sciences] [Google Scholar]
- Helfer, T. T., Thornley, M. D., Regan, M. W., et al. 2003, ApJS, 145, 249 [Google Scholar]
- Kamphuis, J., & Briggs, F. 1992, A&A, 253, 335 [NASA ADS] [Google Scholar]
- Kennicutt, R. C. Jr. 1989, ApJ, 344, 658 [Google Scholar]
- Kennicutt, R. C. Jr. 1998a, ApJ, 498, 541 [NASA ADS] [CrossRef] [Google Scholar]
- Kennicutt, R. C. Jr. 1998b, ARA&A, 36, 189 [Google Scholar]
- Kennicutt, R. C. Jr., Armus, L., Bendo, G., et al. 2003, PASP, 115, 928 [NASA ADS] [CrossRef] [Google Scholar]
- Knapen, J. H., Beckman, J. E., Cepa, J., & Nakai, N. 1996, A&A, 308, 27 [NASA ADS] [Google Scholar]
- Knapen, J. H., Stedman, S., Bramich, D. M., Folkes, S. F., & Bradley, T. R. 2004, A&A, 426, 1135 [NASA ADS] [CrossRef] [EDP Sciences] [Google Scholar]
- Kuno, N., & Nakai, N. 1997, PASJ, 49, 279 [NASA ADS] [Google Scholar]
- Leitherer, C., Schaerer, D., Goldader, J. D., et al. 1999, ApJSS, 123, 3 [NASA ADS] [CrossRef] [Google Scholar]
- Lin, C. C., & Shu, F. H. 1964, ApJ, 140, 646 [NASA ADS] [CrossRef] [MathSciNet] [Google Scholar]
- Lin, C. C., & Shu, F. H. 1966, Proc. Natl. Acad. Sci., 55, 229 [Google Scholar]
- Lord, S. D., & Young, J. S. 1990, ApJ, 356, 135 [NASA ADS] [CrossRef] [Google Scholar]
- Lu, N. Y., Hoffman, G. L., Groff, T., Roos, T., & Lamphier, C. 1993, ApJS, 88, 383 [NASA ADS] [CrossRef] [Google Scholar]
- Meidt, S. E., Rand, R. J., & Merrifield, M. R. 2009, ApJ, 702, 277 [NASA ADS] [CrossRef] [Google Scholar]
- Moustakas, J., Kennicutt, R. C. Jr., Tremonti, C. A., et al. 2010, ApJS, 190, 233 [NASA ADS] [CrossRef] [Google Scholar]
- Roberts, W. W. 1969, ApJ, 158, 123 [NASA ADS] [CrossRef] [Google Scholar]
- Salpeter, E. E. 1955, ApJ, 121, 161 [Google Scholar]
- Sánchez-Gil, M. C., Jones, D. H., Pérez, E., et al. 2011, MNRAS, 415, 753 [NASA ADS] [CrossRef] [Google Scholar]
- Schmidt, M. 1959, ApJ, 129, 243 [NASA ADS] [CrossRef] [Google Scholar]
- Seigar, M. S., & James, P. A. 2002, MNRAS, 337, 1113 [NASA ADS] [CrossRef] [Google Scholar]
- Sellwood, J. A. 2011, MNRAS, 310, 1637 [NASA ADS] [Google Scholar]
- Sofue, Y., Tutui, Y., Honma, M., et al. 1999, ApJ, 523, 136 [NASA ADS] [CrossRef] [Google Scholar]
- Wada, K., Baba, J., & Saitoh, T. 2011, ApJ, 735,1 [NASA ADS] [CrossRef] [Google Scholar]
- Zimmer, P., Rand, R. J., & McGraw, J. T. 2004, ApJ, 607, 285 [NASA ADS] [CrossRef] [Google Scholar]
All Tables
All Figures
|
Fig. 1 Position of the H II regions detected in galaxy NGC 628. Filled circles are the regions considered to belong to the NSN arm, while the filled squares mark the regions considered to belong to the SNS arm. The dashed line represents the position of the co-rotation. North is at the top and east is left. |
| In the text | |
|
Fig. 2 Position of H II regions and the arms in galaxy NGC 5457 from Cedrés & Cepa (2002). Filled circles are the regions selected for this study and that possibly belong to the arm marked with the continuous line. The dashed lines represent the other arms detected for this galaxy. The dot-dashed line represent the possible location of the co-rotation radius (see Sect. 4.2). North is at the top and east is left. |
| In the text | |
|
Fig. 3 Position of the H II regions detected in galaxy NGC 6946. Filled circles are the regions considered for the main north arm. Filled squares, filled diamonds, and filled triangles are the regions considered for the NS arm, the south arm, and the SN arm. Two secondary satellite arms, not included in the study, are represented by the dashed lines. The inner dot-dashed line is the Ω − κ/3 resonance, and the outer dot-dashed line is the Ω − κ/4 resonance. North is at the top and east is left. |
| In the text | |
|
Fig. 4 Age histogram for NGC 628. The white bars represent the whole sample of H II regions for this galaxy. The shaded bars are the regions selected for the study in the arms, as indicated in Fig. 1. |
| In the text | |
|
Fig. 5 Age histogram for NGC 5457. The white bars represent the whole sample of H II regions for this galaxy. The shaded bars are the regions selected for the study in the arm, as indicated in Fig. 2. |
| In the text | |
|
Fig. 6 Age histogram for NGC 6946. The white bars represent the whole sample of H II regions for this galaxy. The shaded bars are the regions selected for the study in the arms, as indicated in Fig. 3. |
| In the text | |
|
Fig. 7 Age map for the H II regions of NGC 628. The meaning of the different symbols is as indicated. |
| In the text | |
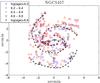 |
Fig. 8 Age map for the H II regions of NGC 5457. Meaning of the symbols as in Fig. 7. |
| In the text | |
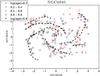 |
Fig. 9 Age map for the H II regions of NGC 6946. Meaning of the symbols as in Fig. 7. |
| In the text | |
|
Fig. 10 Explanation of the deduction of the offset between the hypothetical position of a H II region formed in the centre of the arm and its real position for a clockwise-rotating galaxy. The trailing spiral arm is represented by the thick line. The hypothetical H II region is represented by the open circle. The real position of the H II region is indicated by the filled circle. The angles θi, θR, θA, and the offset δθ (between the arm and the theoretical position of the H II region) are indicated by an arc and the appropriated label. In this diagram it is assumed that the H II region is inside the co-rotation radius of the galaxy. |
| In the text | |
|
Fig. 11 Parameter T (Eq. (4)) as a function of galactocentric distance for the sample of selected H II regions (arm regions) of NGC 628. |
| In the text | |
|
Fig. 12 Parameter T (Eq. (4)) as a function of galactocentric distance for the sample of selected H II regions (arm regions) of NGC 5457. |
| In the text | |
|
Fig. 13 Parameter T (Eq. (4)) as a function of galactocentric distance for the sample of selected H II regions (arm regions) of NGC 6946. |
| In the text | |
|
Fig. 14 Histogram with the median values of the parameter T for 1000 tests for the three galaxies. In each test, the nominal value of the T parameter for each region was varied a random value 3 times its respective error. |
| In the text | |
|
Fig. 15 Parameter T as a function of the logarithm of the SFR for the H II regions in our sample (left panels) and the contour plot of the same quantities obtained with bins of 0.4 in log (SFR) and of 7.7 in T (right panels). The data from the regions of NGC 628, NGC 5457, and NGC 6946 are represented in the uppermost, second and third panels, respectively. The whole sample of H II regions selected in this study is represented in the lowermost panel. In the right panels, the number of regions per bin is indicated by the colour bars. |
| In the text | |
|
Fig. 16 Integrated SFR in bins of 2 Myr versus the T parameter for all the H II regions in the sample. |
| In the text | |
|
Fig. 17 Relative arm and interarm star formation efficiency for NGC 628 versus the deprojected galactocentric radius in bins of 1 kpc width. The filled circles and continuous line represent the data from the NSN arm, filled squares and dashed line represent the data from the SNS arm. |
| In the text | |
|
Fig. 18 Relative arm and interarm star formation efficiency for NGC 5457 versus the deprojected galactocentric radius in bins of 1 kpc width. |
| In the text | |
|
Fig. 19 Angular distance Δθ as obtained in Eq. (3) versus the deprojected galactocentric radius for all the regions in NGC 5457. The vertical line indicates the suggested position for the co-rotation radius. The other two curves indicate the angular limits of the arm. |
| In the text | |
|
Fig. 20 Relative arm and interarm star formation efficiency for NGC 6946 versus the deprojected galactocentric radius in bins of 0.5 kpc width. Symbols as in Fig. 3. |
| In the text | |
Current usage metrics show cumulative count of Article Views (full-text article views including HTML views, PDF and ePub downloads, according to the available data) and Abstracts Views on Vision4Press platform.
Data correspond to usage on the plateform after 2015. The current usage metrics is available 48-96 hours after online publication and is updated daily on week days.
Initial download of the metrics may take a while.