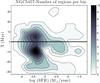
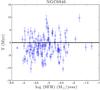
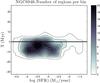
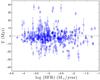
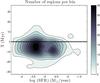
Fig. 15
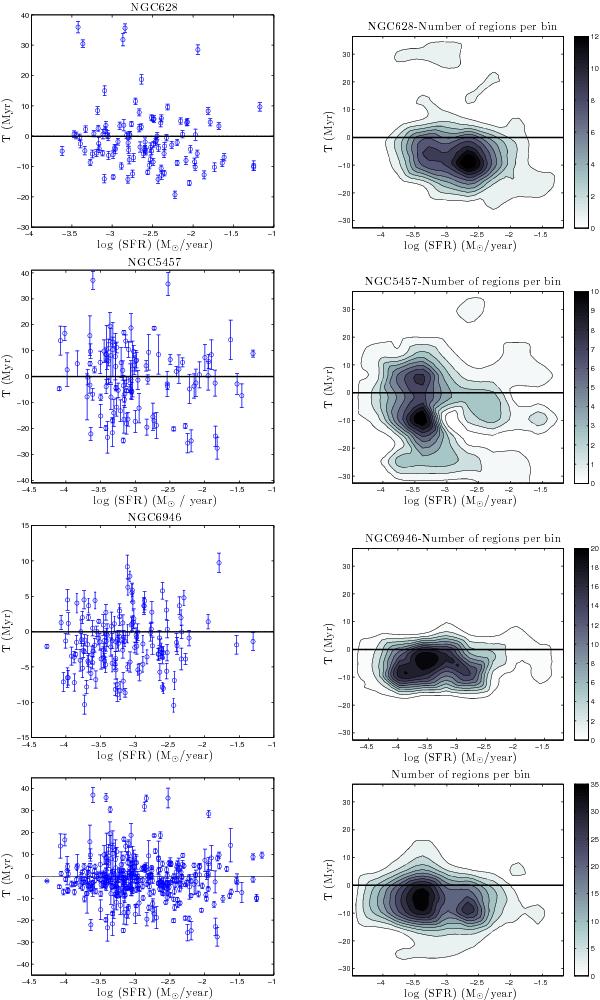
Parameter T as a function of the logarithm of the SFR for the H II regions in our sample (left panels) and the contour plot of the same quantities obtained with bins of 0.4 in log (SFR) and of 7.7 in T (right panels). The data from the regions of NGC 628, NGC 5457, and NGC 6946 are represented in the uppermost, second and third panels, respectively. The whole sample of H II regions selected in this study is represented in the lowermost panel. In the right panels, the number of regions per bin is indicated by the colour bars.
Current usage metrics show cumulative count of Article Views (full-text article views including HTML views, PDF and ePub downloads, according to the available data) and Abstracts Views on Vision4Press platform.
Data correspond to usage on the plateform after 2015. The current usage metrics is available 48-96 hours after online publication and is updated daily on week days.
Initial download of the metrics may take a while.