Fig. 16
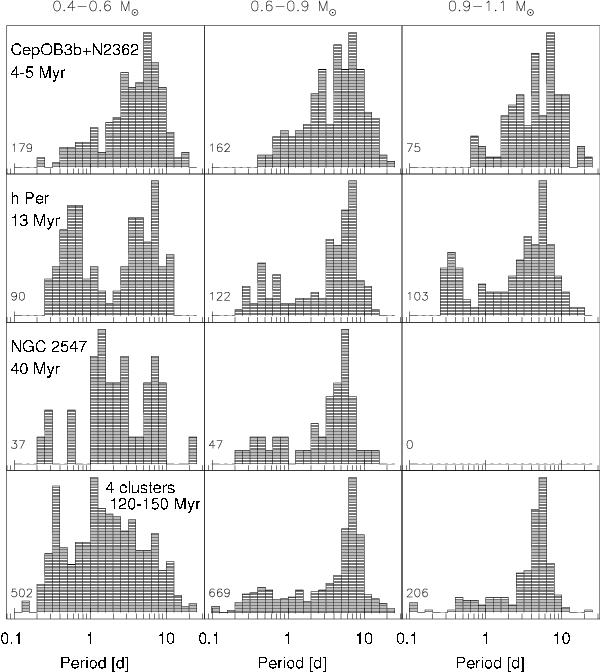
Histograms of period distributions in three mass bins for clusters with an age ranging from 4 to 150 Myr. The clusters’ name and age are given in each panel. Left: 0.4–0.6 M⊙, Middle: 0.6–0.9 M⊙, Right: 0.9–1.1 M⊙. The number of stars in each mass bin is indicated in the lower left corner of the panels.
Current usage metrics show cumulative count of Article Views (full-text article views including HTML views, PDF and ePub downloads, according to the available data) and Abstracts Views on Vision4Press platform.
Data correspond to usage on the plateform after 2015. The current usage metrics is available 48-96 hours after online publication and is updated daily on week days.
Initial download of the metrics may take a while.