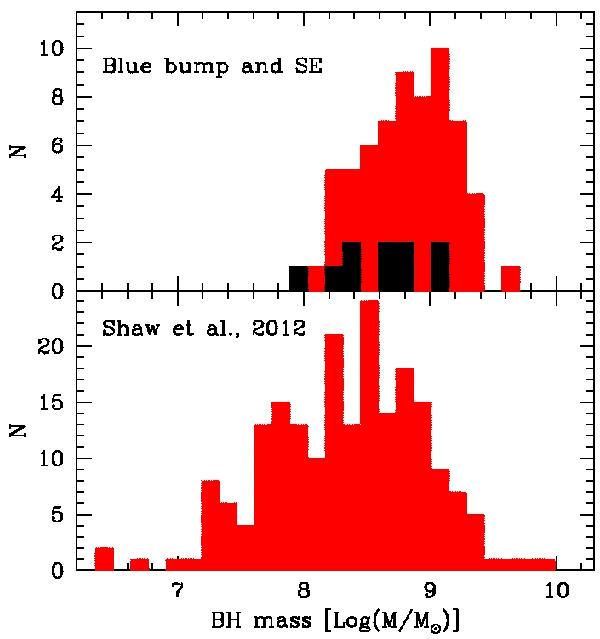
Fig. 4

Distributions of BH masses. The upper panel shows in red the distribution for our 54 objects having estimates via blue bump fitting and, in black, for 10 additional objects in the sample for which we have BH mass estimates via the SE method, homogenized as described in the text and decreased by 0.09 dex to remove the mean offset with blue bump estimates. The lower panel shows the distribution for all 1LAC blazars (Shaw et al. 2012) with masses decreased by 0.09 dex.
Current usage metrics show cumulative count of Article Views (full-text article views including HTML views, PDF and ePub downloads, according to the available data) and Abstracts Views on Vision4Press platform.
Data correspond to usage on the plateform after 2015. The current usage metrics is available 48-96 hours after online publication and is updated daily on week days.
Initial download of the metrics may take a while.


