Fig. 2
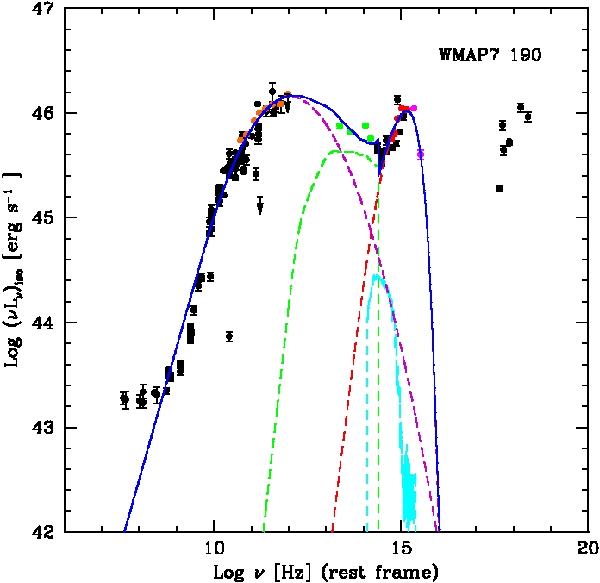
Example of an SED fit (WMAP7 # 190). Solid blue parabola: total SED, which includes synchrotron emission, host galaxy, disk and torus emissions; dashed violet line: synchrotron from the jet; green dashed line: torus; dashed cyan line: host galaxy, taken to be a passive elliptical with MR = −23.7; dashed red line: accretion disk. Orange points: Planck data; green: WISE data; red: SDSS data; magenta: GALEX data. Black points: data taken from the NASA/IPAC Extragalactic Database (NED). At variance with what was done to compute Ld (see text), the luminosities shown here are computed assuming isotropic emission.
Current usage metrics show cumulative count of Article Views (full-text article views including HTML views, PDF and ePub downloads, according to the available data) and Abstracts Views on Vision4Press platform.
Data correspond to usage on the plateform after 2015. The current usage metrics is available 48-96 hours after online publication and is updated daily on week days.
Initial download of the metrics may take a while.