Fig. 2
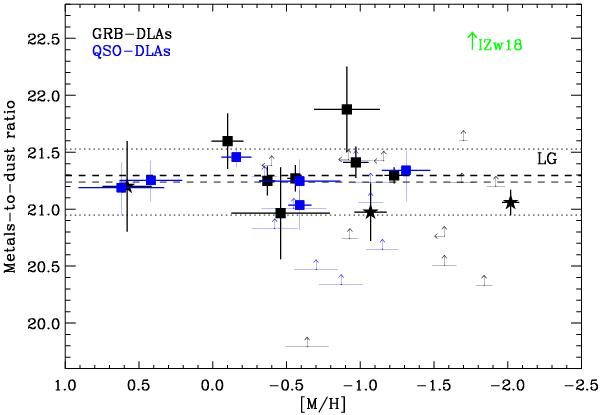
Metals-to-dust ratio ((log NH i/cm-2 + [M/H]) – log AV/mag) versus metallicity for GRB afterglows (black) and QSO-DLAs (blue). The black dashed line represents the LG metals-to-dust relation. The gray dashed line is the mean metals-to-dust ratio of our sample and standard deviation is illustrated by dotted lines. The symbols have the same meaning as in Fig. 1. For comparison, the upper limit derived by Herrera-Camus et al. (2012) from SED modeling of the lowest metallicity galaxy known in the local universe, I Zw 18, is plotted in green.
Current usage metrics show cumulative count of Article Views (full-text article views including HTML views, PDF and ePub downloads, according to the available data) and Abstracts Views on Vision4Press platform.
Data correspond to usage on the plateform after 2015. The current usage metrics is available 48-96 hours after online publication and is updated daily on week days.
Initial download of the metrics may take a while.