Fig. 8
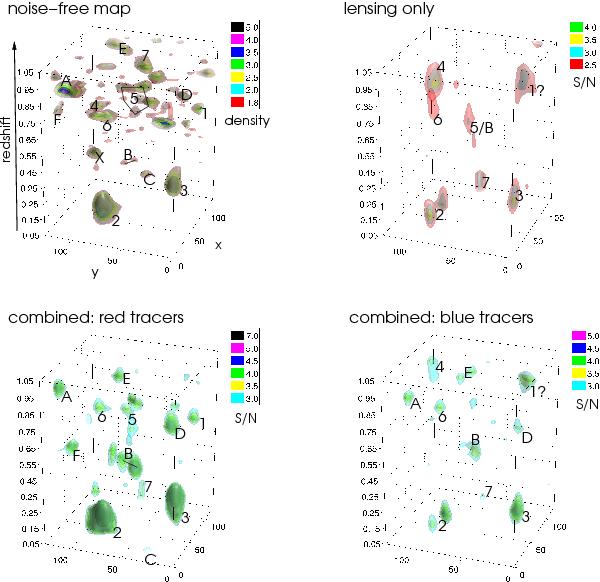
Simulated reconstructions of the original N-body data in the top left panel (density contrast iso-surfaces). The lens planes covering one square degree have sizes of 128 × 128 pixel2 on the x- and y-axes. All maps are subject to smoothing (Gaussian kernel with two arcmin r.m.s. width). Top right: reconstruction using only the lensing information (α = 0.05). Bottom left: reconstruction adding information from red galaxy tracers with mu − mr ≥ 2.2 (α = 0.05, β = 0.5). Bottom right: reconstruction including information from blue galaxies tracers with mu − mr > 2.2 (α = 0.05, β = 0.5). The number and capital letter labels indicate mass peak matches across different maps. The simulated reconstructions display S/N iso-surfaces. The combined maps do not account for GSN.
Current usage metrics show cumulative count of Article Views (full-text article views including HTML views, PDF and ePub downloads, according to the available data) and Abstracts Views on Vision4Press platform.
Data correspond to usage on the plateform after 2015. The current usage metrics is available 48-96 hours after online publication and is updated daily on week days.
Initial download of the metrics may take a while.