Fig. 5
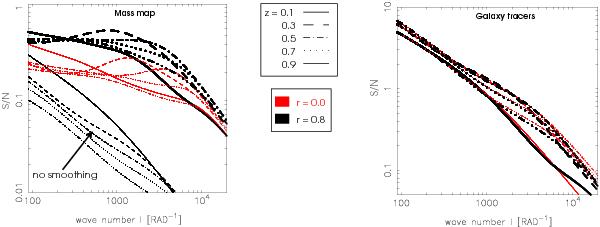
S/N of density modes for the matter density maps (left panel) and galaxy tracer density maps (right panel). The lines assume cosmic-average fluctuations in the density fields and b(ℓ) = 1 for the tracers. Different line styles correspond to different lens plane redshifts: z = 0.1 (solid), z = 0.3 (dashed), z = 0.5 (dash-dotted), z = 0.7 (dotted), and z = 0.9 (dot-dot-dashed). The black thin lines do not employ any smoothing, while red thins lines use smoothing. Both use no mixing of lensing and galaxy clustering information. In the right panel, red and black thin lines coincide. Thick lines depict values in a Wiener smoothed map (α = 0.01, β = 0.1) and a mixing with r(ℓ) = 0.8 for all redshifts. The S/N does not include GSN.
Current usage metrics show cumulative count of Article Views (full-text article views including HTML views, PDF and ePub downloads, according to the available data) and Abstracts Views on Vision4Press platform.
Data correspond to usage on the plateform after 2015. The current usage metrics is available 48-96 hours after online publication and is updated daily on week days.
Initial download of the metrics may take a while.