Fig. 2
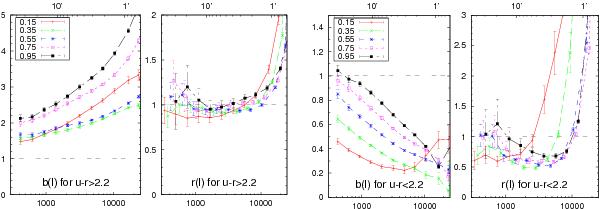
Galaxy bias parameters b(ℓ) and r(ℓ) in the Millennium Simulation data set as a function of angular scale ℓ (x-axis) and galaxy redshift (curves; see key for mean redshifts). The top numbers denote the corresponding aperture radius (arcmin) of the aperture statistics that were utilised to infer the galaxy bias from angular correlation functions (polynomial filter). The left panels correspond to red galaxies with mr < 25 and mu − mr > 2.2 and the right panels to blue galaxies with mr < 25 and mu − mr ≤ 2.2. The error bars denote the remaining standard error based on 128 simulated survey fields with one square degree each.
Current usage metrics show cumulative count of Article Views (full-text article views including HTML views, PDF and ePub downloads, according to the available data) and Abstracts Views on Vision4Press platform.
Data correspond to usage on the plateform after 2015. The current usage metrics is available 48-96 hours after online publication and is updated daily on week days.
Initial download of the metrics may take a while.