Fig. 4
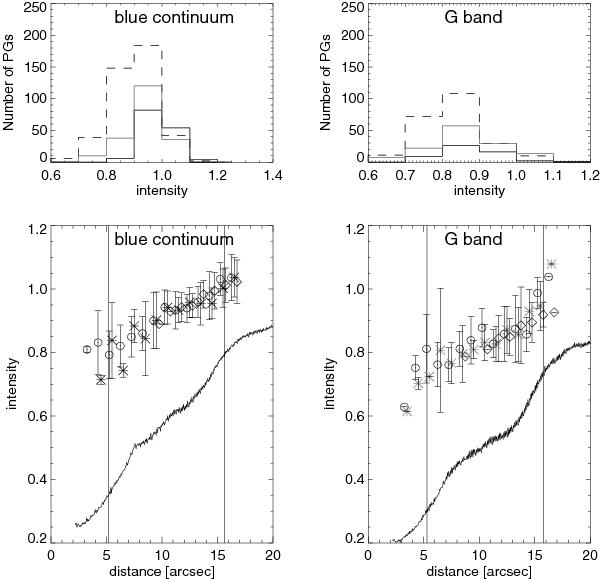
Upper panels: histogram of PGs average brightness for blue continuum (left) and G band (right). Black dashed line (INW), black solid line (OUT), and gray solid line (STB). Bottom panels: average brightness as a function of position in the penumbra. Circle signs represent INW, diamond signs represent OUT, and star signs represent STB. The bars indicate a scatter of ±1σ. The dark curve represents the mean intensity averaged over the azimuthal direction at each radial bin. Vertical lines represent the boundary of umbra and penumbra and the boundary of penumbra and surrounding granulation, respectively. The intensity here is measured by the intensity of PG relative to quiet Sun intensity.
Current usage metrics show cumulative count of Article Views (full-text article views including HTML views, PDF and ePub downloads, according to the available data) and Abstracts Views on Vision4Press platform.
Data correspond to usage on the plateform after 2015. The current usage metrics is available 48-96 hours after online publication and is updated daily on week days.
Initial download of the metrics may take a while.